Academic Project

Optimization of CFD Simulation Parameters for a NACA 4412 Airfoil

Duration 2 Months
Team 4 Members
Tools ANSYS Fluent, ANSYS Meshing, Taguchi DOE
0.96%
Optimal Composite Error
8
Taguchi L8 Simulations
-30.58%
Dominant Factor Effect (Mesh Method)
1.43%
Lift Coefficient Error vs Experiment

Removing Guesswork from CFD Mesh Setup

CFD accuracy is highly sensitive to mesh configuration, yet mesh parameters are often chosen by trial identify the mesh configuration that best reproduces wind-tunnel data for a NACA 4412 airfoil at Re = 1×10⁶, using only 8 simulations instead of a full factorial campaign. The study was carried out as a 4-person team project.

Taguchi Design of Experiments

A composite error function was defined to jointly evaluate lift and drag prediction accuracy, weighting CD by a = CL,exp / CD,exp = 8.75 to balance the two coefficients' relative magnitude. Three mesh parameters, each at two levels, were then studied using a Taguchi L8 orthogonal array, reducing the required simulations from 2³ = 8 full-factorial runs' worth of variables to 8 structured runs while still resolving all main effects and two-factor interactions.

A : Mesh Sizing

Global mesh element size, 5 mm (low) vs 10 mm (high), controlling overall domain resolution.

B : Edge Sizing

Element size along the airfoil edges, 100 mm vs 150 mm, controlling boundary-layer and near-wall resolution.

C : Mesh Method

Triangular (low) vs quadrilateral (high) element topology.

Run A : Mesh Size (mm) B : Edge Size (mm) C : Method
15100Triangular
210100Triangular
35150Triangular
410150Triangular
55100Quadrilateral
610100Quadrilateral
75150Quadrilateral
810150Quadrilateral
Simulation Configurations

Geometry, Domain & Mesh

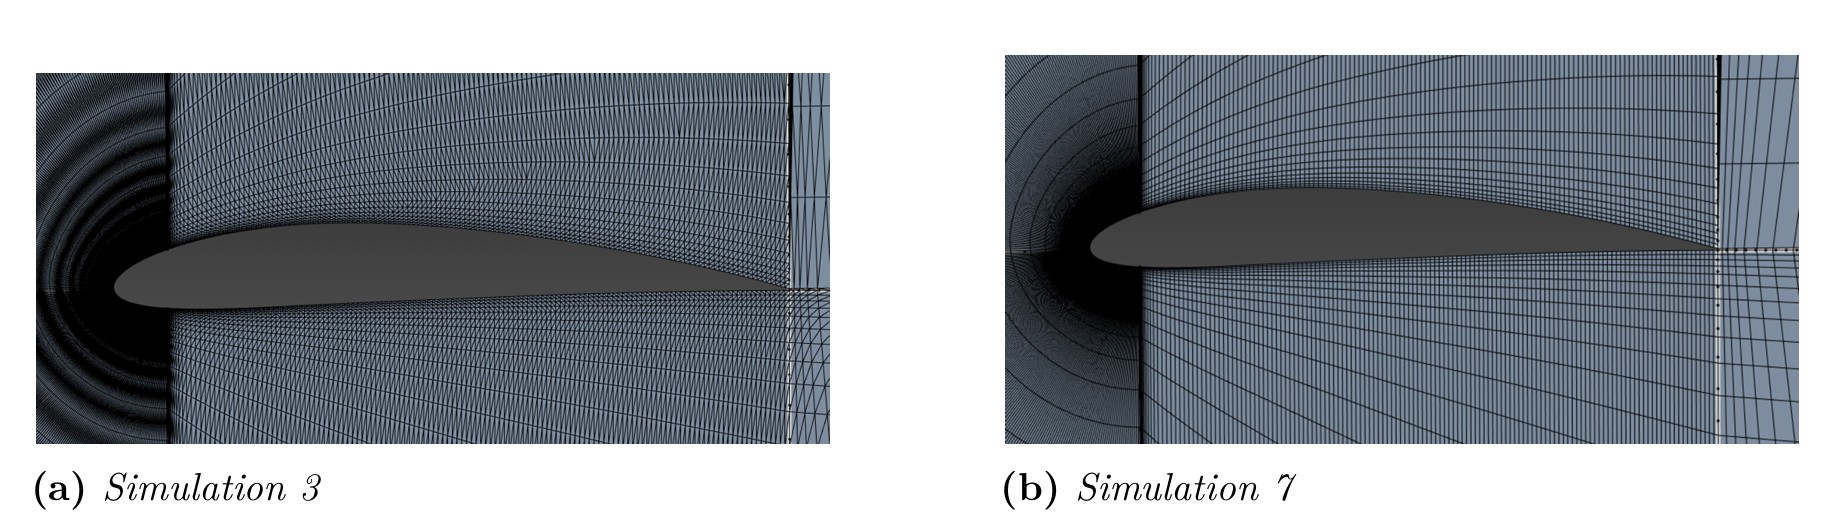
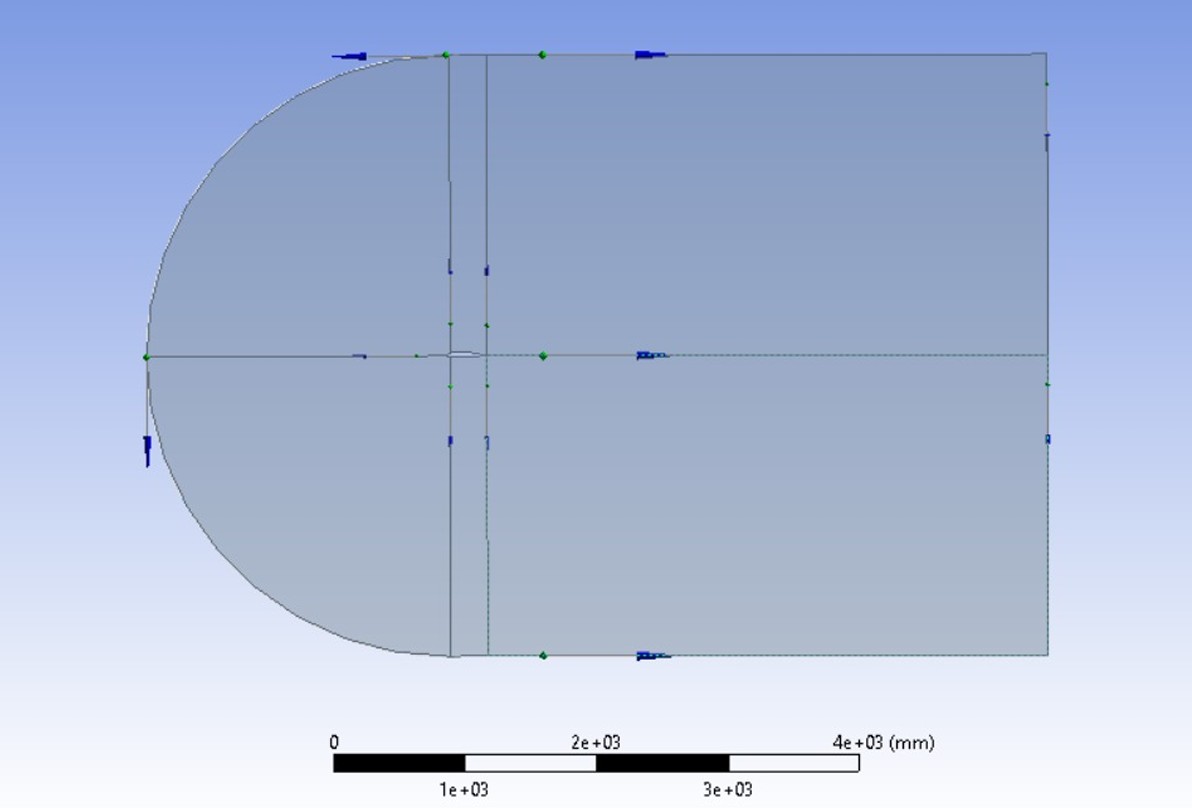
The NACA 4412 geometry (4% max camber at 40% chord, 12% max thickness) was built in Design Modeler. The computational domain followed standard CFD best practices: 7.5c upstream, 15c downstream and 7.5c laterally, sized to prevent boundary conditions from artificially influencing the near-field flow and to fully capture wake development.

NACA 4412 airfoil geometry positioned within the computational domain
Close-up comparison of triangular versus quadrilateral mesh elements around the airfoil

Effects, Interactions & Optimal Configuration

Each of the 8 runs produced a composite error ranging from 0.79% to 97.46%, confirming that mesh configuration has a first-order effect on CFD accuracy for this case. Factor and interaction effects were then computed by comparing mean error between high and low levels of each variable.

Run A B C Composite Error Y (%)
1-1-1-19.35
2+1-1-111.82
3-1+1-197.46
4+1+1-110.61
5-1-1+10.96
6+1-1+13.14
7-1+1+10.79
8+1+1+12.05
Design of Experiments — Results
Factor Effect (%) Absolute Effect (%)
A : Mesh sizing-20.2420.24
B : Edge sizing+21.4121.41
AB : Interaction-22.5622.56
C : Method-30.5830.58
AC : Interaction+21.9621.96
BC : Interaction-22.0422.04
ABC : Interaction+22.1022.10
Grand mean M17.02–
Calculated Effects of Parameters and Interactions
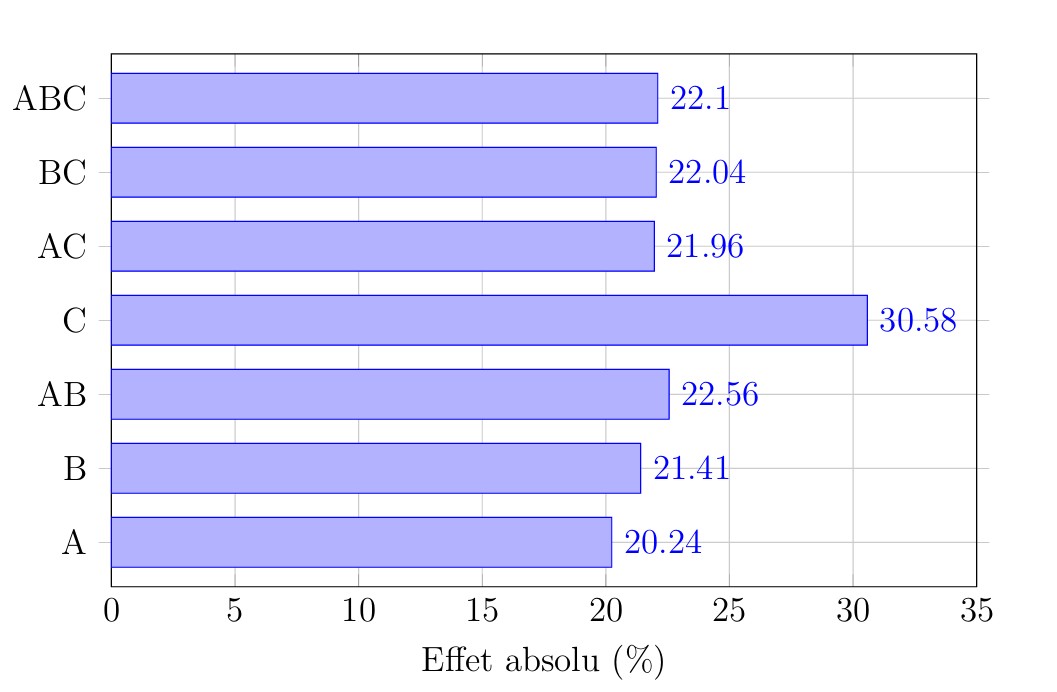
Pareto diagram ranking the absolute effect of each mesh parameter and interaction on simulation error
Diagram ranking the absolute effect of each mesh parameter and interaction on simulation error

Dominant Factor

Mesh method (C) is the most influential parameter, with an effect of -30.58%. Switching from triangular to quadrilateral elements substantially reduces error, quadrilateral elements introduce less numerical diffusion and better resolve flows with a dominant direction, such as attached boundary-layer flow over an airfoil.

Parameter Optimal Level Value
Mesh sizing (A)-110 mm
Edge sizing (B)-1100 mm
Method (C)+1Quadrilateral
Optimal Configuration Identified

This configuration corresponds to Run 5, which achieved the lowest composite error of the campaign at 0.96%, consistent with the effects model's prediction of 2 to 4% for the optimal factor combination.
Comparison with Experimental Data

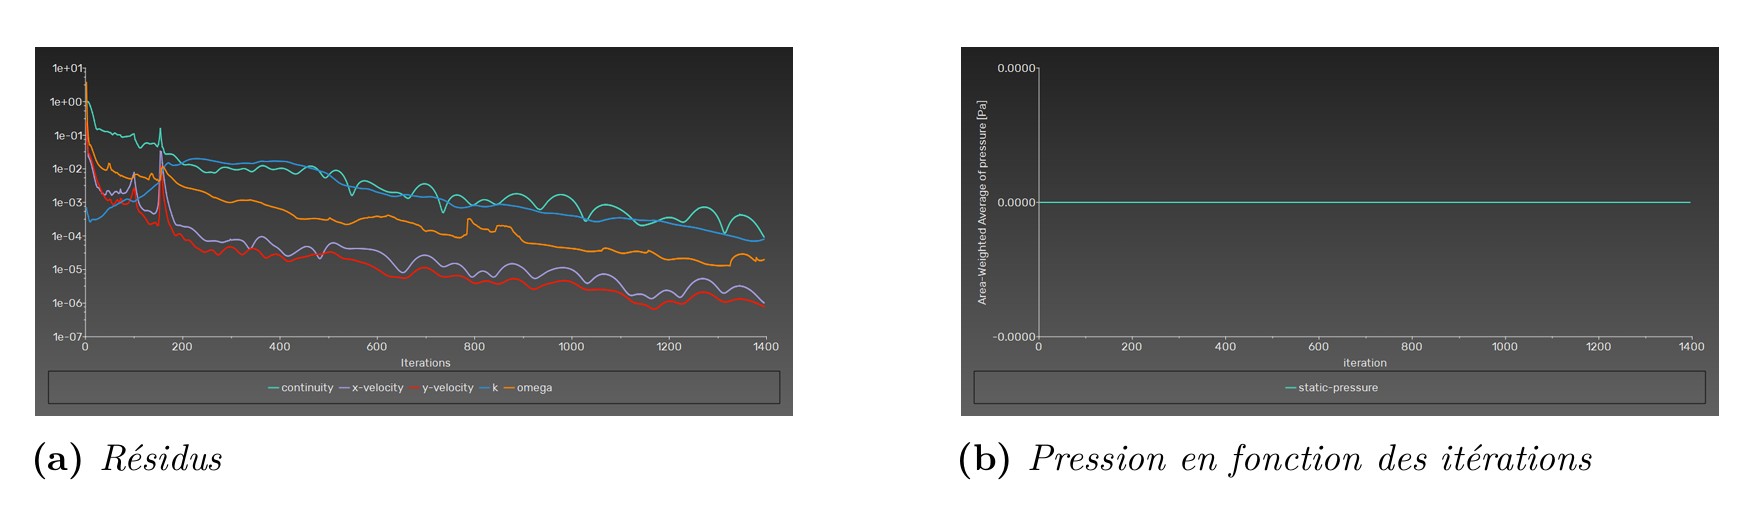
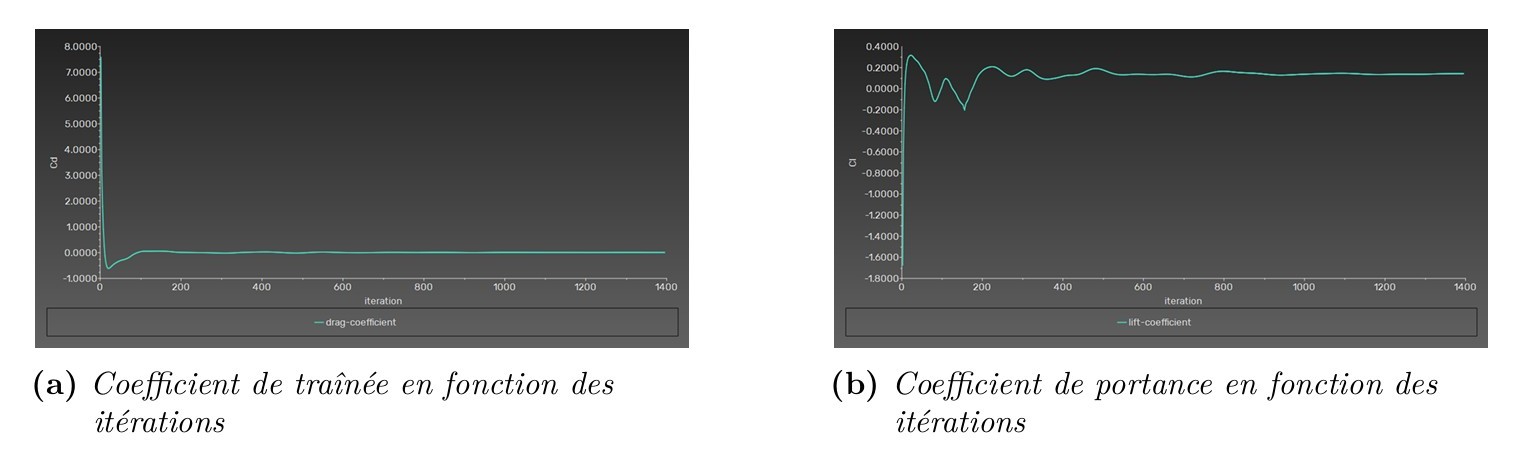
The optimal configuration (Run 5) was checked for solution convergence, then its predicted aerodynamic coefficients were compared directly against wind-tunnel reference data.

Convergence history of continuity, velocity, k and omega residuals for the optimal simulation
Convergence history of lift and drag coefficients for the optimal simulation
<1e-5
Residual Level at Convergence
~200
Iterations to Stabilize Coefficients
CL = 0.345
Predicted Lift Coefficient (exp. 0.35)
CD = 0.0398
Predicted Drag Coefficient (exp. 0.04)
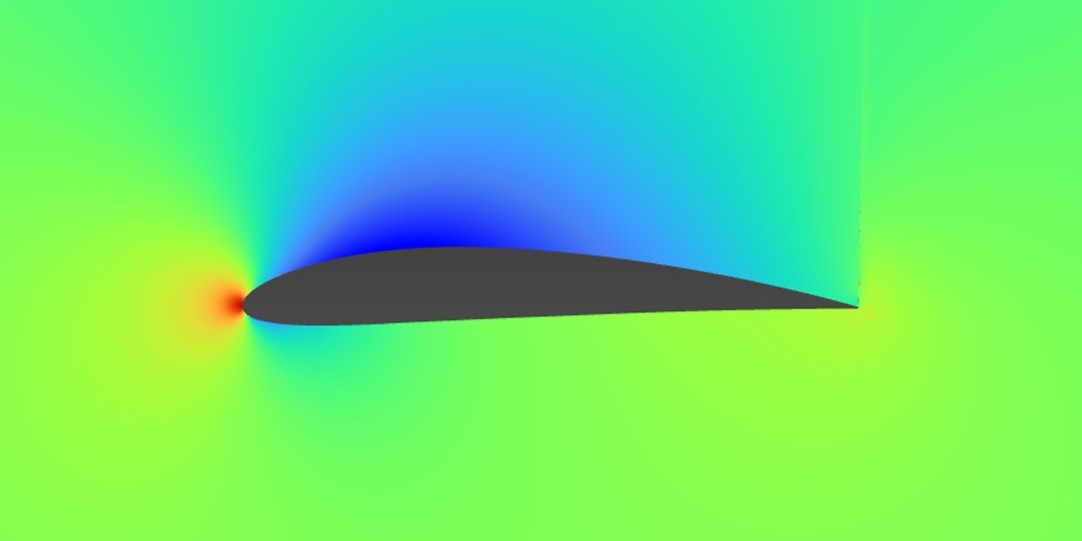
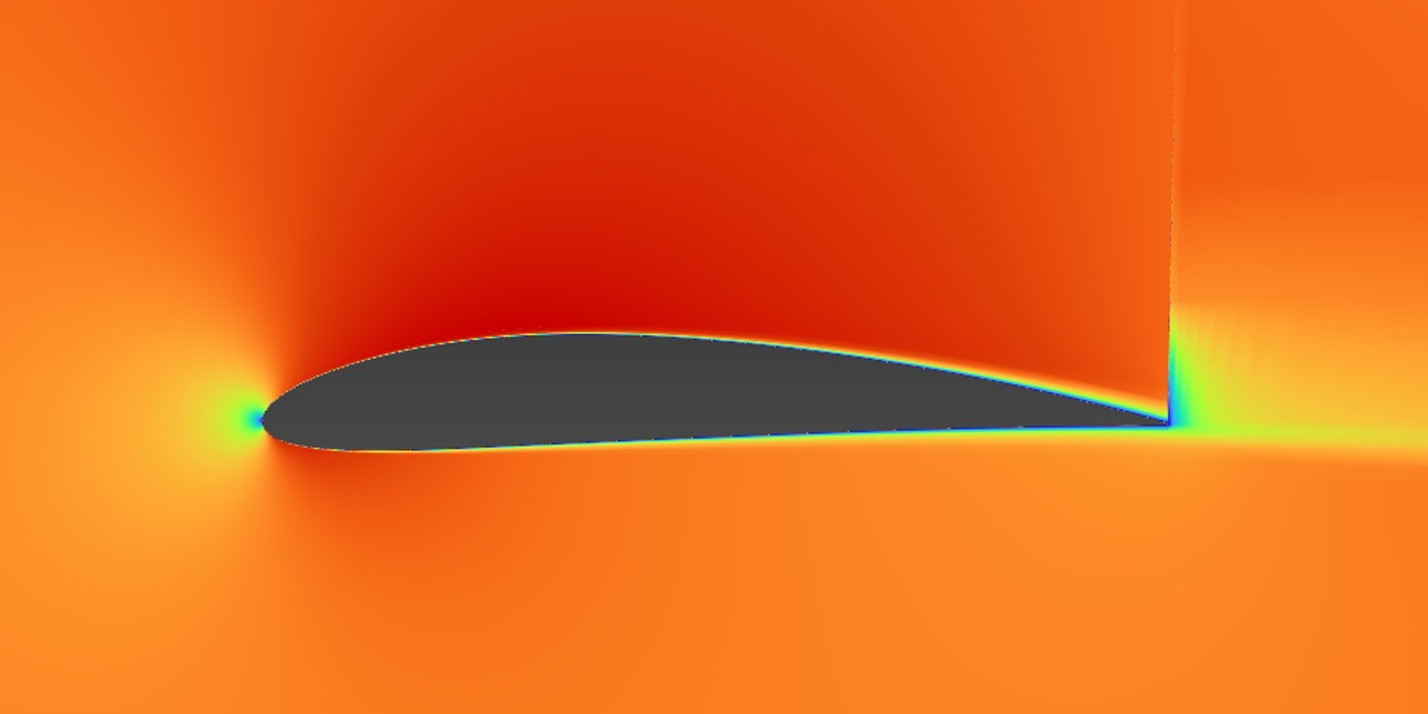
Static pressure contour around the NACA 4412 airfoil showing suction and pressure sides
Velocity magnitude contour around the NACA 4412 airfoil
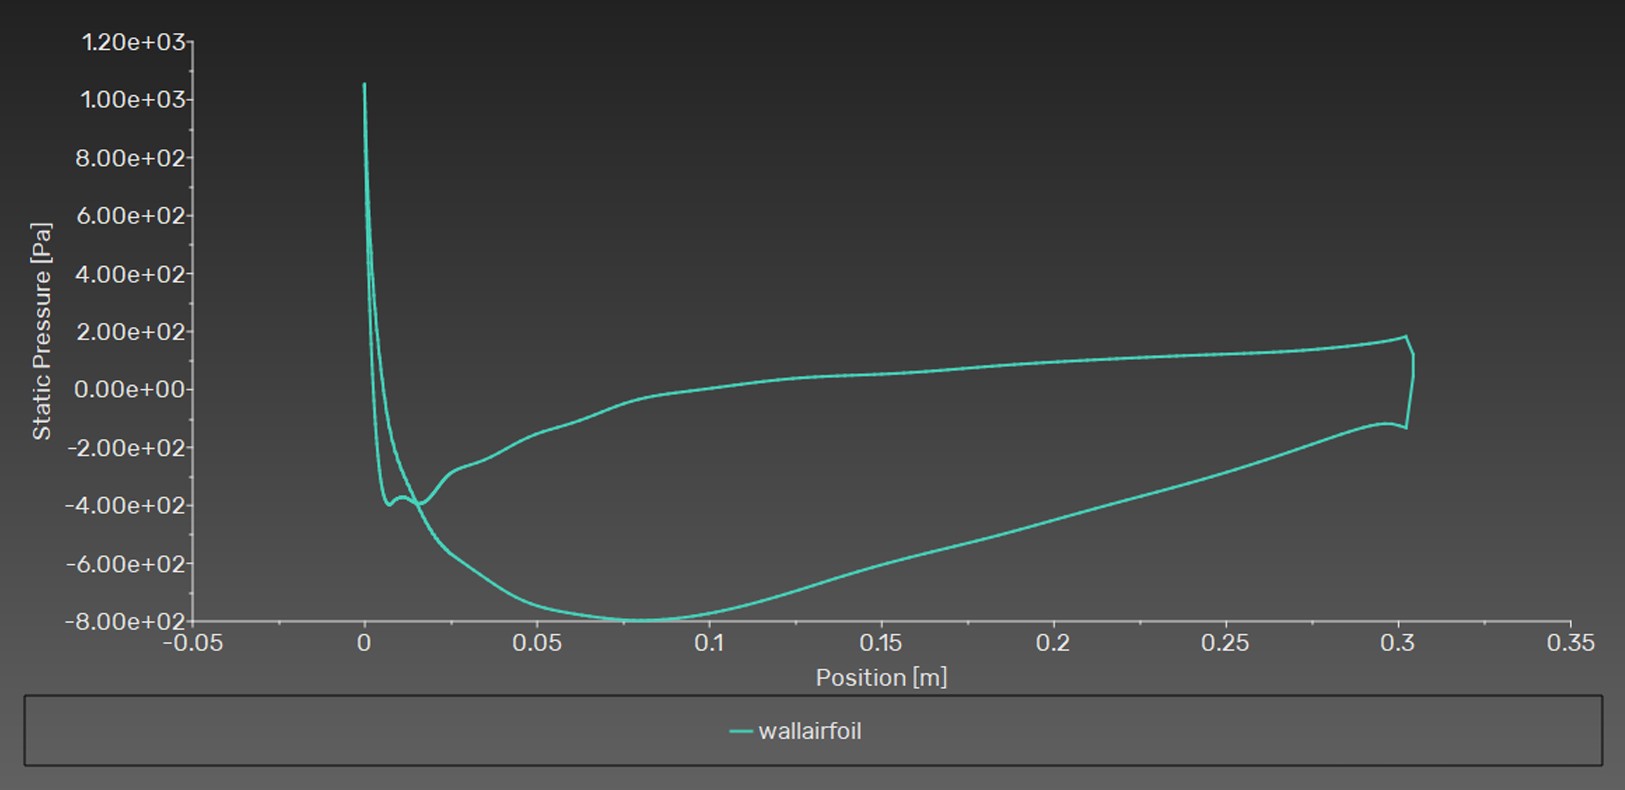
Static pressure plotted along the airfoil wall from leading to trailing edge

Pressure and velocity fields are physically consistent with expected airfoil aerodynamics: overpressure on the pressure side and suction on the suction side generating lift, flow acceleration on the suction side per the Venturi effect, a regular boundary layer with no separation at this angle of attack, and a stable, symmetric wake.

Limitations & Recommendations

The study's scope and its practical implications for future CFD work were both examined critically.

Single Reynolds Number

Limited to Re = 1×10⁶; optimal mesh parameters may differ in laminar or transitional regimes.

Zero Angle of Attack

Optimized at α = 0°; near-stall conditions with massive boundary-layer separation could shift the optimal configuration.

2D, Steady RANS

k-ω SST is a validated but approximate turbulence closure; 3D tip effects and unsteady vortex shedding are not captured.

Key Takeaways

The Taguchi method proved to be an efficient framework for CFD parameter optimization, identifying the best-performing mesh configuration from only 8 simulations while quantifying the relative influence of each parameter and their interactions, a structured, reproducible alternative to trial-and-error mesh setup.

0.96%
Composite Error (Optimal Config)
1.43%
CL Error vs Experiment
0.50%
CD Error vs Experiment
Download Project Report