Professional Experience

Hydraulic Performance Analysis of a Centrifugal Pump

Duration 2 Months
Team 2 Members
Company OCP Group
Tools ANSYS Fluent, Python, ANSI/HI 9.6.7
3.85%
Total Head Loss Error (CFD vs Theory)
10-22%
Efficiency Drop Due to Fluid Viscosity
-7 to -12 m
NPSH Deficit : Cavitation Confirmed
0.686
Q / Q(BEP) : Operating Left of BEP

Diagnosing a Recurring Hydraulic Fault

A centrifugal pump (LC50-350 N1) in a viscous fluid transfer circuit at OCP's JFC2 unit was showing degraded performance and reliability issues. The study combines the ANSI/HI 9.6.7 viscosity-correction standard with a CFD cross-validation in ANSYS Fluent to diagnose the root cause, quantify cavitation risk, and evaluate corrective solutions.

Contributions

Project carried out with one teammate. I was responsible for the full pump diagnosis, the optimization and solution trade-off study, and an independent CFD validation of the theoretical head-loss model using ANSYS Fluent.

Cavitation & Performance Diagnosis

Applied the ANSI/HI 9.6.7 viscosity-correction method to the pump's operating data, quantified the efficiency loss due to viscosity, and computed the NPSH deficit confirming a cavitation risk.

Optimization Study

Modeled the singular loss coefficient with a Python polynomial interpolation, evaluated suction-circuit elevation, and compared it against a pump replacement option.

CFD Cross-Validation

Built and ran an ANSYS Fluent simulation of the suction circuit to independently verify the analytical head-loss calculation, explaining the source of the discrepancy between the two approaches.

Cavitation Risk & Performance Analysis

Because the pumped fluid is significantly more viscous than water, the manufacturer's water-based performance curves overstate the pump's real capability. The ANSI/HI 9.6.7 procedure was applied to correct flow, head, efficiency and required NPSH for viscosity effects.

Parameter Value
Nominal flow rate (Q)29 m³/h
Total head (H)38.5 m
NPSHa (nominal)6.3 m
NPSHr (nominal)1.5 m
Fluid temperature85 °C
Viscosity200 cP
Vapor pressure142 mmHg abs (18.93 kPa)
Density (SG = 1.73)1730 kg/m³
Hydraulic power5.25 kW
Absorbed power at Q = 29 m³/h21 kW
Nominal rotation speed1733 rpm
Flow rate at BEP42.3 m³/h
Pump Operating Data Summary (LC50-350 N1)
Parameter Min Case Case A Case B
Kinematic viscosity (cSt)27.78138.89115.61
Dynamic viscosity (cP)40200200
N (rpm)173317331733
H(BEP) (m)747474
Q(BEP) (m³/h)424242
Pump Parameters (Pre-Correction Reference Values)
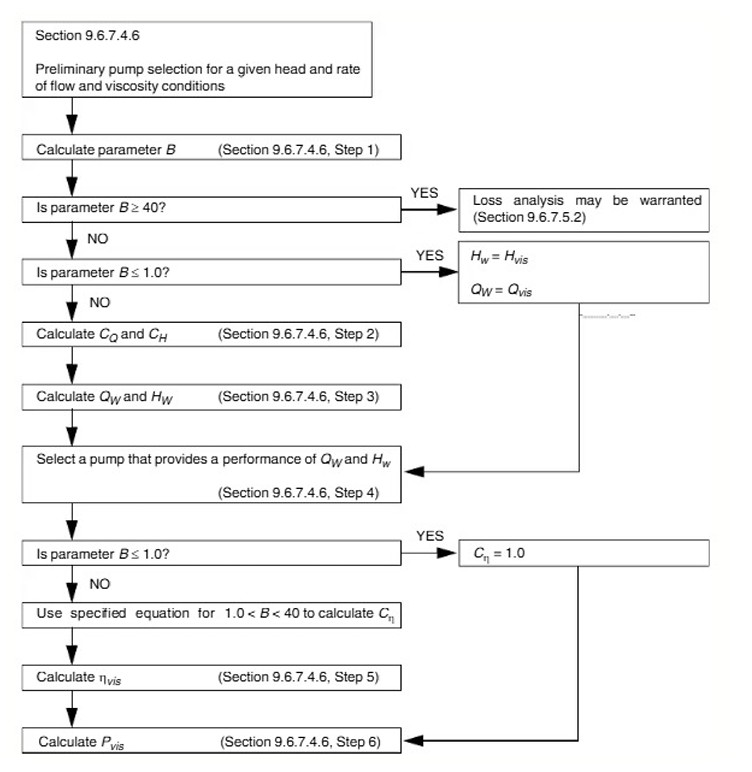
Flowchart of the ANSI/HI 9.6.7 procedure for determining pump performance on a viscous fluid from water-based performance data
Flowchart of the ANSI/HI 9.6.7 procedure
Parameter Min Case Case A Case B
Viscosity parameter B4.349.718.86
Flow correction factor CQ0.960.850.87
Corrected BEP head (m)71.1163.1964.41
Corrected flow rate (m³/h)27.8724.7625.24
Efficiency correction factor Cη0.800.550.58
Water efficiency ηW (%)49.0049.0049.00
Corrected efficiency ηvis (%)39.2726.9828.62
Corrected NPSHr (m)9.1614.2713.42
Viscosity Correction Calculation Results
Parameter Min Case Case A Case B
Specific gravity1.441.441.73
Kinematic viscosity (cSt)27.78138.89115.61
Dynamic viscosity (Pa·s)0.040.200.20
Reynolds number Re5680.611136.121364.92
Darcy friction factor fD0.130.060.05
Pipe length L (m)7.607.605.10
Linear head loss HL (m)4.721.981.11
Hydraulic Calculation Parameters and Results
Metric Value
Polynomial degree8
Coefficient of determination (R²)0.999424
RMSE0.014553
Singular Head Loss Coefficient — Polynomial Fit
Parameter Min Case Case A Case B
Head losses Hf (m)4.8622.1171.243
Suction height Zs (m)1.3001.3002.500
Vapor pressure Pv (Pa)22,66552,1299,066
NPSH available (m)2.0122.6696.699
NPSH required (m)19.15914.26813.417
Deficit (m)-7.147-11.599-6.718
NPSH Available and Deficit Calculation

Cavitation Confirmed

In all three scenarios (Min, Case A, Case B), NPSH available falls short of NPSH required by roughly 7 to 12 meters, and the pump operates at Q/Q(BEP) = 0.686, left of its Best Efficiency Point. Together, these confirm an active cavitation risk and explain the observed performance degradation.
Improvement Solutions & Trade-off Analysis

Three corrective paths were investigated: raising the suction circuit, resizing the piping, and replacing the pump. A Python-based polynomial interpolation was first built to model the singular loss coefficient as a continuous function of pipe diameter.

Parameter Min Case Case A Case B
Added vertical length l (m)20.0017.0010.00
Pipe length L (m)7.607.605.10
Linear head loss HL (m)17.166.413.28
Total head loss Hf (m)17.306.553.41
NPSH available (m)9.5815.2414.53
NPSH required (m)9.1614.2713.42
Deficit (m)+0.42+0.97+1.11
Results of the Different Configurations (Vertical Elevation Solution)

Adding 10 to 20 meters of vertical suction height closes the NPSH deficit in all three scenarios. The new total manometric head (HMT) was then checked against the pump's available head to confirm feasibility.

Parameter Min Case Case A Case B
Total manometric head, original (m)17.6020.3018.50
Added vertical length (m)20.0017.0010.00
Added linear head loss (m)12.434.432.17
New total HMT (m)50.0341.7330.67
Pump available head Hvis (m)77.6371.1572.15
Margin (m)27.6029.4241.48
HMT Verification

The pump retains enough available head to overcome the new HMT in all three cases, confirming technical feasibility, but this solution requires heavy modification of the existing installation. A pump replacement was therefore also evaluated as a lower-disruption alternative.

Parameter Min Case Case A Case B
Rotation speed N (rpm)2900.002900.002900.00
Corrected BEP head H(BEP-vis) (m)40.8835.7536.52
Corrected flow Q(vis) (m³/h)27.5724.1124.63
Water efficiency ηW (%)55.0055.0055.00
Corrected efficiency ηvis (%)42.4727.8929.79
Corrected NPSHr (m)4.906.756.42
NPSHr Calculation for the Lowara 22SV Pump
Parameter Min Case Case A Case B
NPSH available (m)2.012.676.70
NPSH required (m)4.906.756.42
Deficit (m)-2.88-4.08+0.28
Deficit Calculation for the Lowara 22SV Pump

Recommended Direction

A vertical multistage pump (Lowara 22SV, 2900 rpm, 4 stages) delivers 29 m³/h at ≈85 m head, resolving the cavitation deficit in Case B and reducing it substantially in the Min and A cases, at the cost of a 4 kW drive motor, a standard, lower-disruption alternative to modifying the existing suction circuit.

Addendum : Simulation ANSYS Fluent

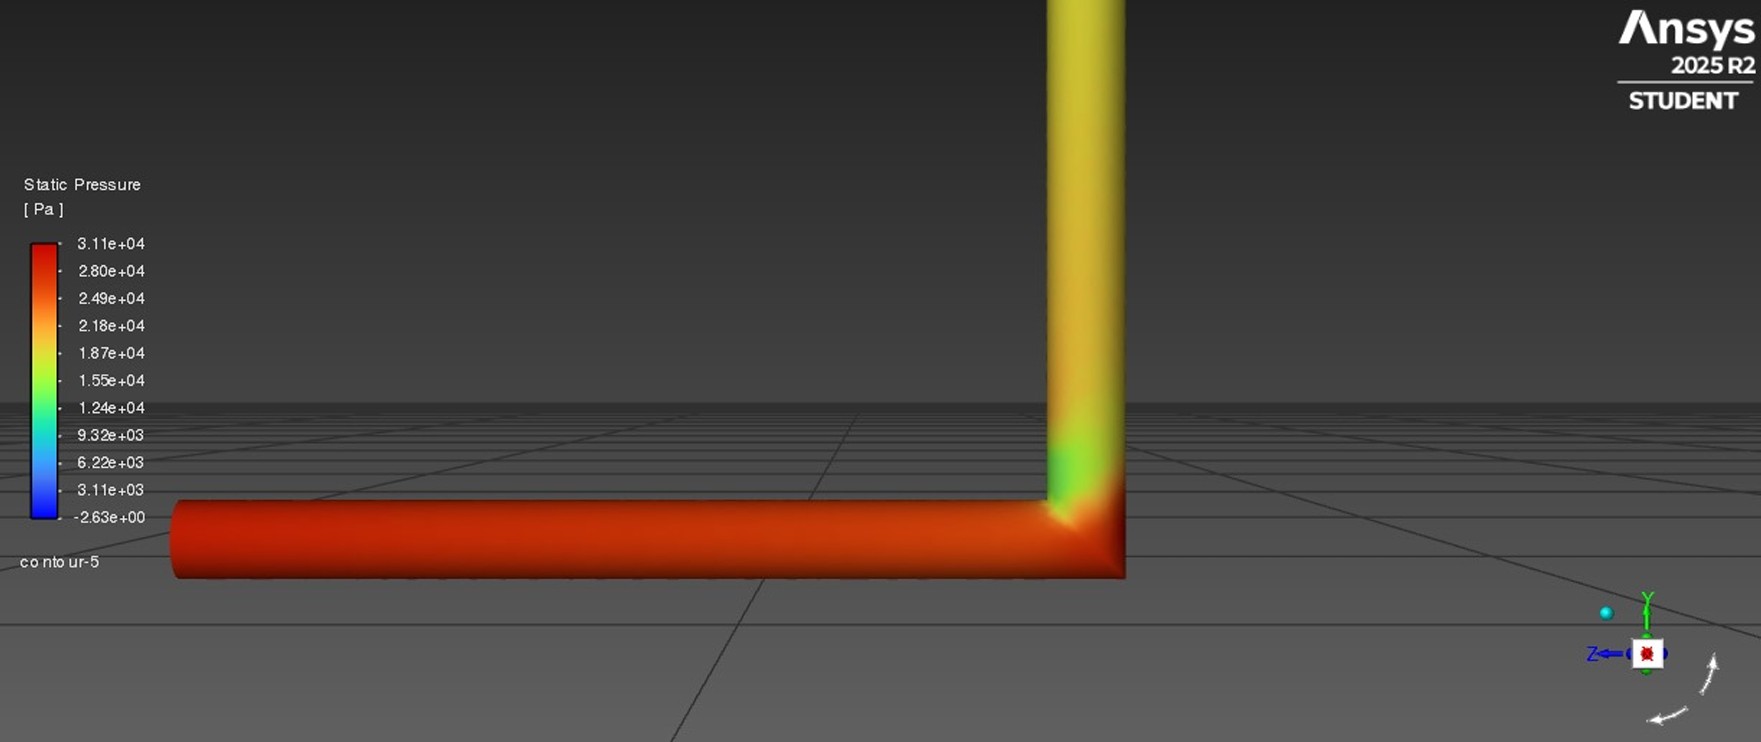
To go beyond the simplifying assumptions of the analytical correlations, a CFD simulation of the suction circuit was built in ANSYS Fluent to independently quantify head losses and pressure distribution, cross-check the theoretical predictions, and explain an observed 12% gap between the two approaches.

The modeled circuit reproduces the real installation at a constant diameter of 8 cm over a total length of 7.6 m (L/D = 95), preserving the main singularities (elbows, valves) while simplifying the rest of the geometry. The fluid was defined in Fluent with its actual density and dynamic viscosity rather than using default water properties.

Static pressure profile plotted along the pipe elbow from the CFD simulation
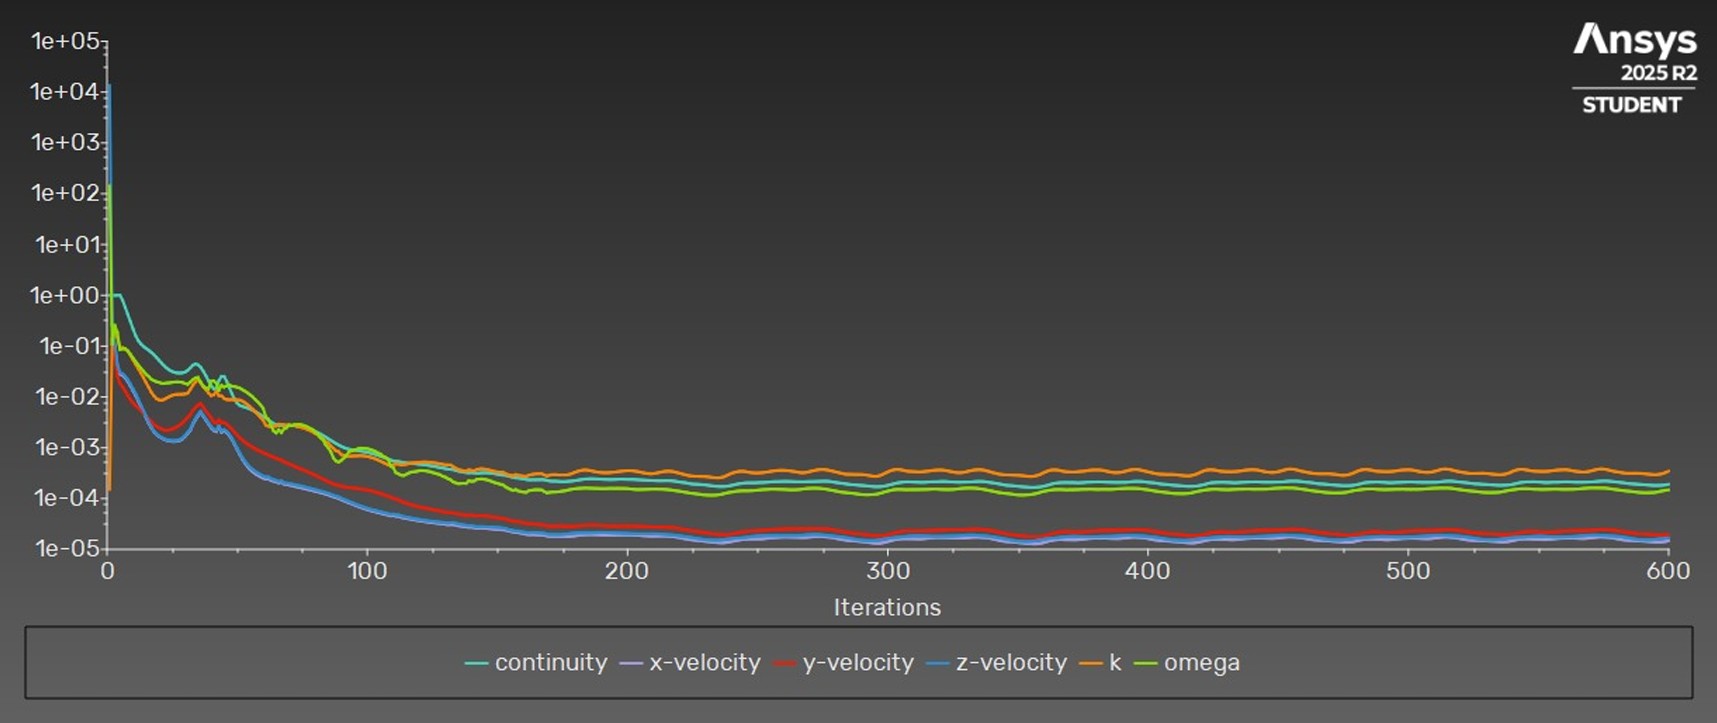
Convergence history of continuity, velocity, k and omega residuals in ANSYS Fluent
Convergence History : Continuity, Velocity, k and Omega Residuals
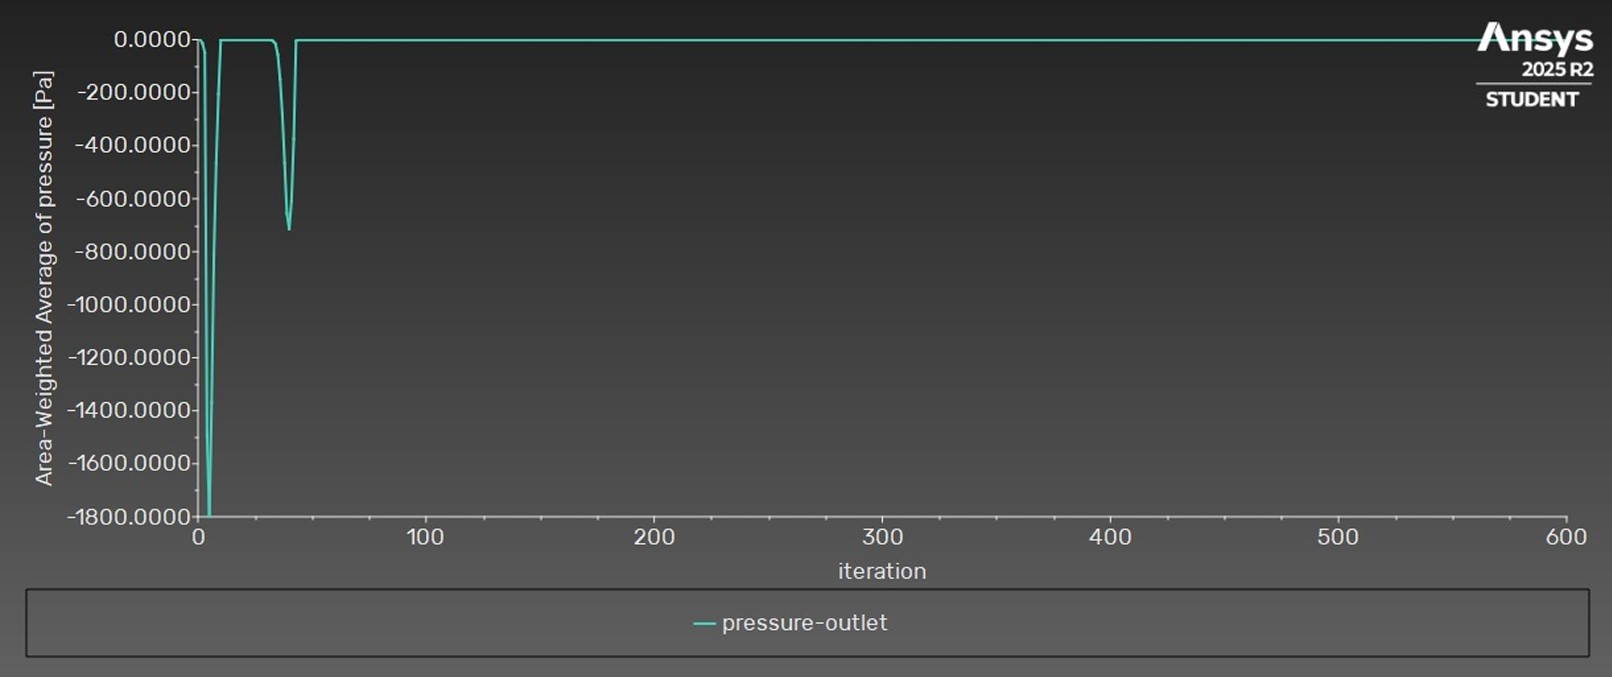
Convergence of the outlet pressure monitor over solver iterations
Outlet Pressure Monitor Convergence
Loss Type CFD Simulation (m) Theoretical (m) Difference (m) Error (%)
Total head loss2.202.120.083.85
Singular (minor) losses0.220.140.0837.62
Linear (friction) losses1.981.980.000.11
CFD vs Theoretical Head Loss : Comparison

Interpretation

Linear (friction) losses match almost exactly (0.11% error), validating the CFD model's ability to capture wall friction. The larger gap on singular losses (37.62%) reflects a known limitation of theoretical correlations, which use averaged coefficients for elbows and ignore the three-dimensional turbulence-geometry interactions that CFD resolves directly. Despite this local discrepancy, the total head loss prediction remains accurate to within 3.85%, confirming that the theoretical approach is reliable for overall system-level engineering analysis.

Outcome

3.85%
Total Head Loss Error (CFD vs Theory)
-7 to -12 m
NPSH Deficit : Cavitation Confirmed
4 kW
Replacement Motor Sizing
Solution Principle Result
Pipe resizing Adjust pipe diameter and length NPSHa increased, but requires heavy modification of existing piping
Suction circuit elevation Raise suction height (10–20 m) to increase NPSHa NPSHa exceeds NPSHr in all cases, at the cost of extra head loss and installation work
Pump replacement (Lowara 22SV) Multistage vertical pump, lower NPSHr Deficit reduced to -2.88 / -4.08 / +0.28 m; requires a 4 kW motor
Technical Solutions Comparison

The combined analytical and numerical approach identified the root cause of the pump's degraded performance, operation left of the BEP under viscous conditions, with insufficient available NPSH and validated pipe elevation and pump replacement as viable, quantified corrective paths, with the CFD study independently confirming the reliability of the theoretical head-loss model at the system level.

Key Takeaways

This project combined a standards-based analytical diagnosis (ANSI/HI 9.6.7) with CFD simulation to fully characterize and address a real industrial cavitation problem, moving from root-cause identification to quantified, comparable corrective solutions.

Download Project Report Summary