Project Summary
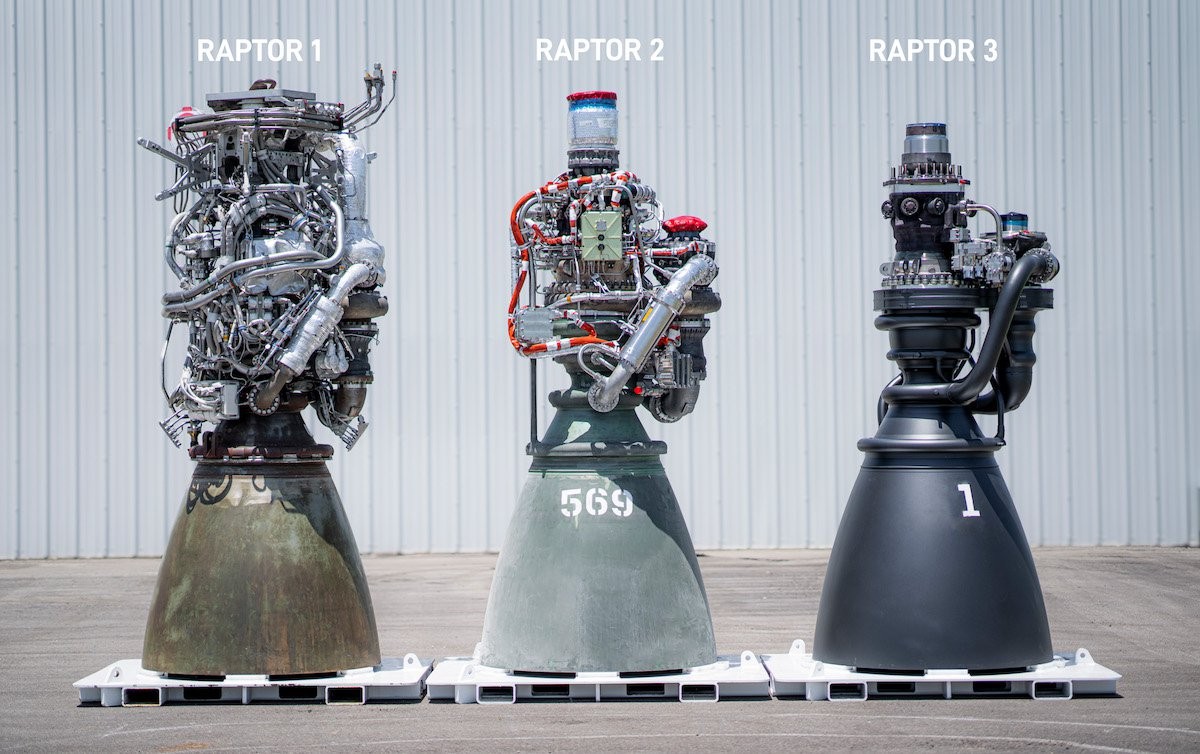
A personal deep-dive into rocket propulsion CFD: a high-fidelity simulation of the internal flow dynamics inside the SpaceX Raptor 2 engine, from the combustion chamber through the converging-diverging nozzle. The project models the methane-oxygen combustion process using the GRI-Mech kinetics database (53 species, 325 reactions), the resulting supersonic nozzle flow, and thermal loads on the chamber walls, all using ANSYS Fluent with the RANS k-ω SST turbulence model and a beta-PDF combustion approach. Eight simulations were conducted across different O/F ratios, propellant states, and operating environments (vacuum vs. sea level) to characterize the Full-Flow Staged Combustion (FFSC) cycle performance.
Why the Raptor 2?
The Raptor 2 is one of the world's highest-performance rocket engines, operating at a chamber pressure of 300 bar in a Full-Flow Staged Combustion (FFSC) cycle, the most thermodynamically efficient propulsion cycle ever flown. Both propellant streams (CH₄ and LOX) are pre-burned in separate preburners before entering the main chamber, enabling near-complete combustion. This project was driven by personal curiosity and a desire to push beyond academic project boundaries into real-world propulsion engineering.
Key Responsibilities
I independently designed, set up, and ran the entire simulation, from reconstructing the engine geometry from public data to configuring the reacting flow solver and interpreting the results.
Geometry Reconstruction
Reconstructed the Raptor 2 combustion chamber and nozzle geometry from publicly available technical data and SpaceX documentation, parameterizing the nozzle contour using the method of characteristics.
Structured Mesh Generation
Generated a 2D axisymmetric structured mesh with refined inflation layers near the chamber walls and nozzle throat to capture the thermal and velocity boundary layers accurately.
Combustion Modeling
Configured ANSYS Fluent with the GRI-Mech chemical kinetics database (53 species, 325 reactions) and a beta-PDF combustion model (presumed PDF approach) for turbulence-chemistry interaction. Inlet conditions for 8 simulations varied O/F ratio (3 and 3.6), propellant state (liquid/gaseous/ real FFSC fractions), and operating environment (vacuum vs. sea level).
Compressible Flow Setup
Configured the pressure-based SIMPLE algorithm solver for steady-state simulation with Favre-averaged RANS equations and k-ω SST turbulence model. Second-order upwind spatial discretization. Turbulent intensity: 10% at fuel inlets (swirling), 5% at oxidizer inlets. Adiabatic wall boundary conditions with no-slip. Axisymmetric boundary condition applied along the engine axis.
Thermal Analysis
Analyzed wall heat flux distribution along the chamber and nozzle walls, identifying the throat as the critical thermal load point, consistent with real engine cooling design priorities.
Performance Extraction
Extracted thrust, specific impulse (Isp), nozzle exit Mach number, and compared against published Raptor 2 performance data to validate the simulation approach.
Development Methodology
Step 1: Engine Geometry Reconstruction
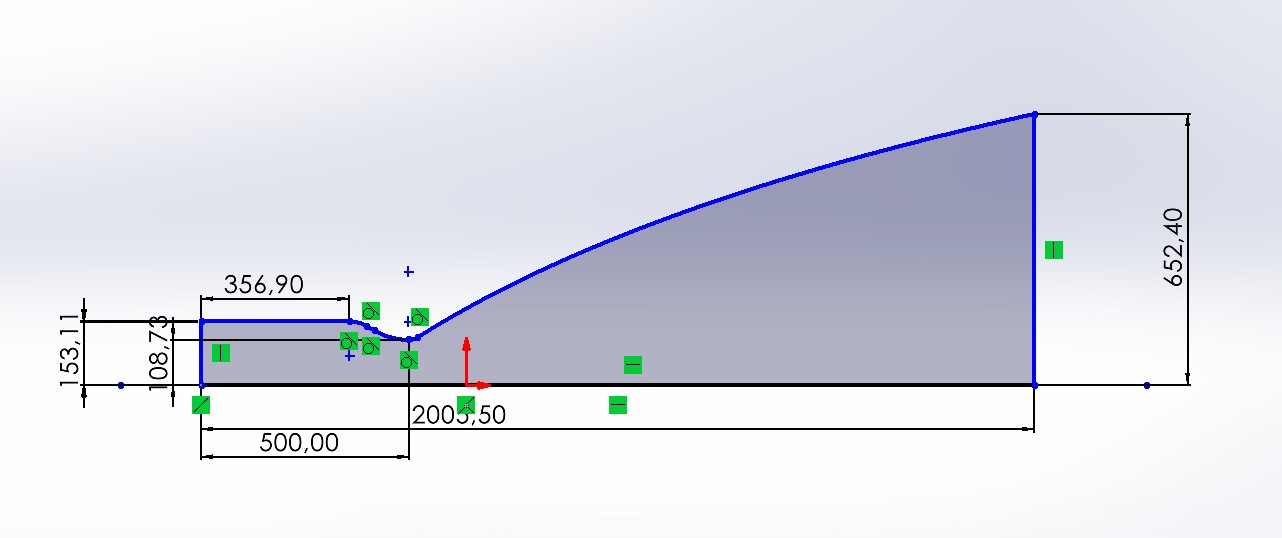
Reconstructed the Raptor 2 internal geometry using RPA outputs. The nozzle contour was generated using the Method of Characteristics (MOC). The geometry was built and imported as a 2D axisymmetric sketch.
Step 2: 2D Axisymmetric Simplification
Modeled the engine as a 2D axisymmetric domain for the main combustion chamber and nozzle flow. Simplified 2D injectors were modeled to reduce computational cost while preserving key flow physics.
Step 3: Mesh Generation & Refinement
Generated a structured quadrilateral mesh with strong refinement at the nozzle throat and chamber walls. Performed a mesh independence study to ensure grid convergence.
Step 4: Combustion & Turbulence Setup
Used the Species Transport model with a global CH₄/O₂ mechanism. Configured turbulence and radiation models to capture high-temperature combustion gas behavior.
Step 5: Solver Configuration
Density-based coupled solver with implicit formulation for stability at high Mach numbers. Second-order upwind spatial discretization for all transport equations.
Step 6: Post-Processing & Validation
Extracted Mach number, temperature, pressure, and species mass fraction contours. Computed thrust and Isp from exit plane conditions and compared against published Raptor 2 data.
Engine Geometry & Mesh
Combustion Chamber & Nozzle Geometry
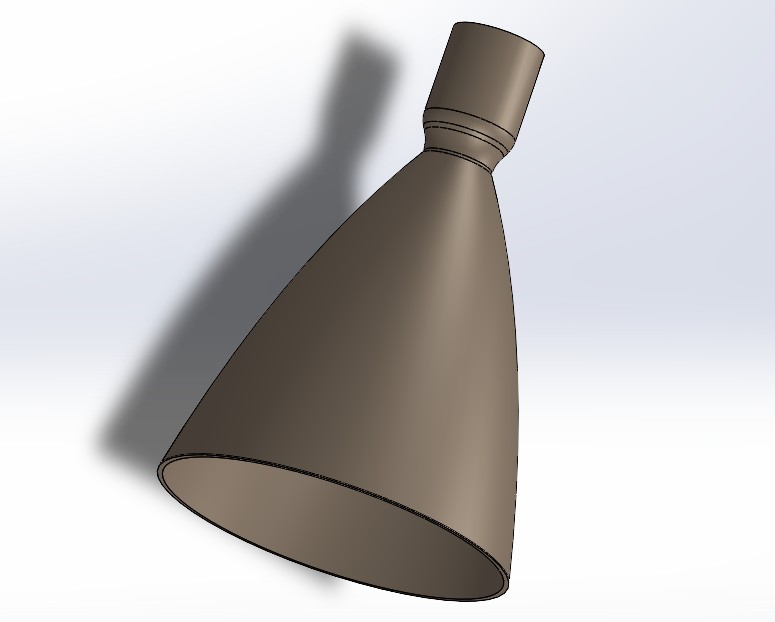
The Raptor 2 operates in a full-flow staged combustion cycle: both the fuel-rich and oxidizer-rich preburner exhaust gases enter the main combustion chamber at high pressure and temperature, enabling near-complete combustion before expansion through the nozzle. The geometry modeled here covers the main combustion chamber (cylindrical section) and the converging-diverging nozzle.
| Geometric Parameter | Value | Source |
|---|---|---|
| Chamber Diameter (Dc) | 306.22 mm | RPA output (Rocket Propulsion Analysis) |
| Throat Diameter (Dt) | 217.47 mm | RPA output |
| Nozzle Exit Diameter (De) | 1304.80 mm | RPA output (area ratio ε = 36) |
| Nozzle Contour | Method of Characteristics (MOC) | RPA built-in MOC solver |
| Mixture Ratio (O/F) | 3.6 | Optimal CH₄/LOX ratio (FFSC cycle) |
| Number of Injectors | 640 total (10 modeled in 2D) | Simplified for axisymmetric domain |
Mesh
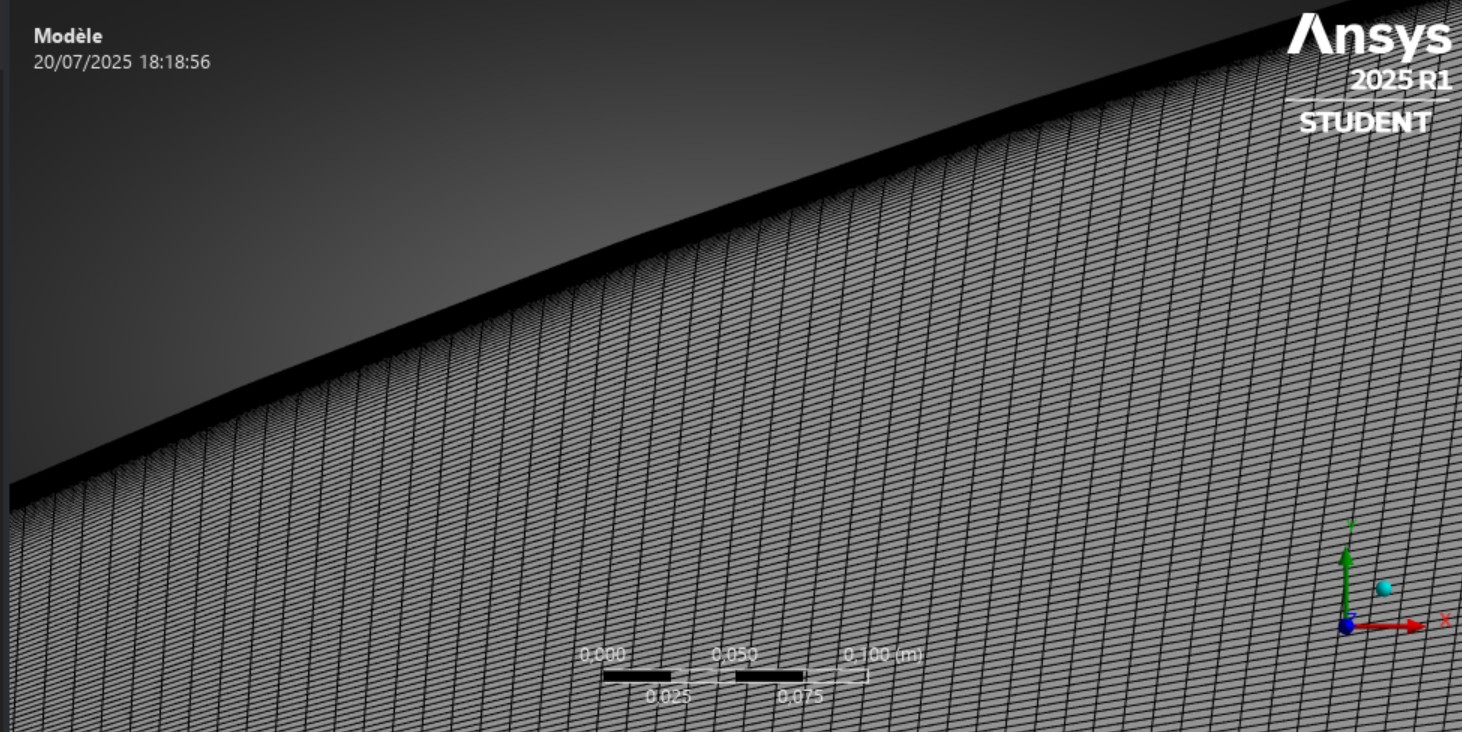
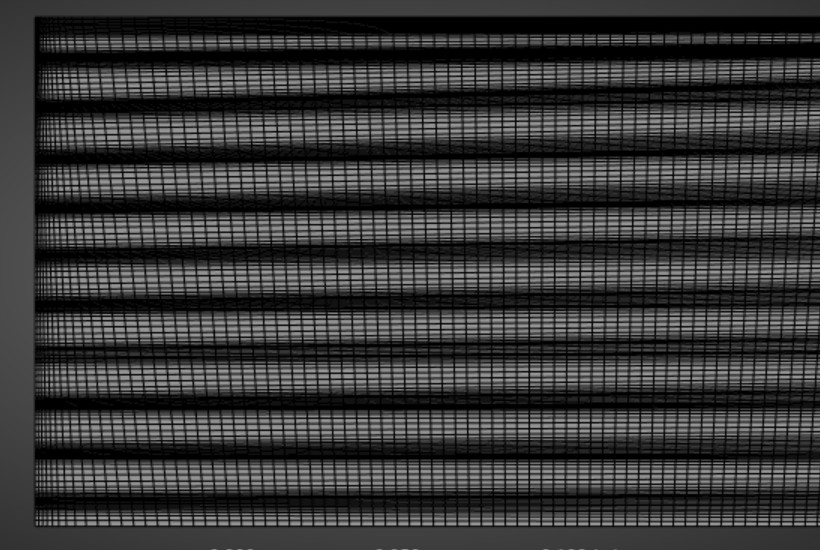
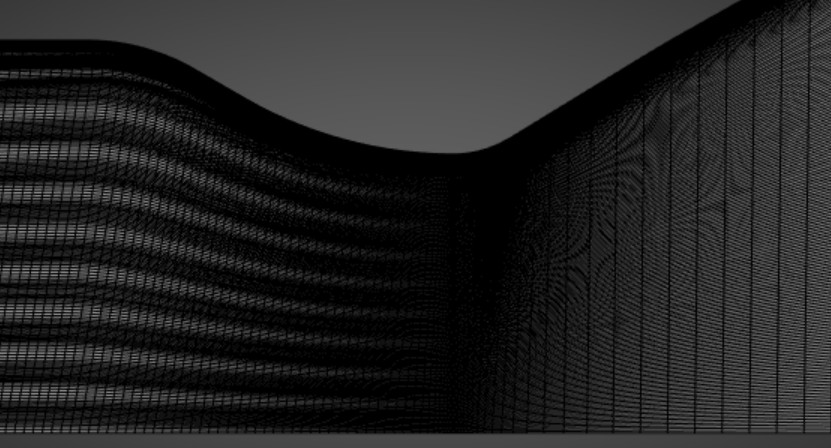
Mesh Refinement
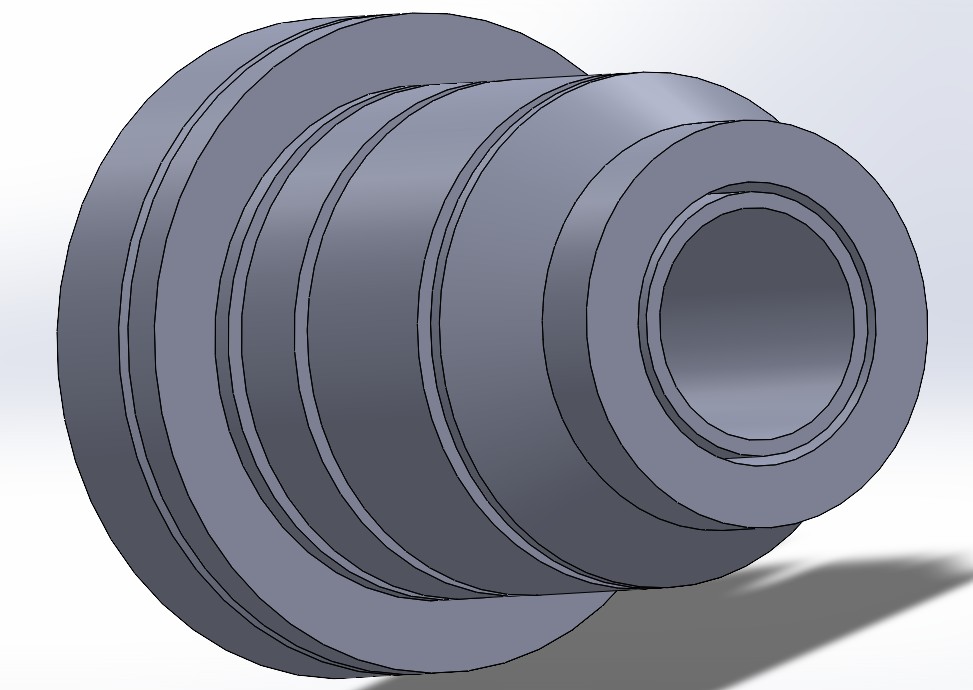
The mesh was refined near the chamber and nozzle walls with inflation layers to accurately capture the viscous boundary layer and resolve the thermal and velocity gradients in these critical regions.
Combustion Chamber Analysis
Reacting Flow Model
The GRI-Mech 3.0 chemical kinetics database (53 species, 325 reactions) was used with a beta-PDF (presumed PDF) combustion model for turbulence-chemistry interaction. This approach accounts for turbulent fluctuations in temperature and species concentrations. The Favre-averaged RANS equations govern the flow, with the k-ω SST turbulence model. Eight simulations were run (5,000 iterations each) varying O/F ratio (3 and 3.6), propellant state (liquid CH₄/LOX, gaseous CH₄/LOX, and real FFSC fractions), and operating environment (vacuum vs. sea level).
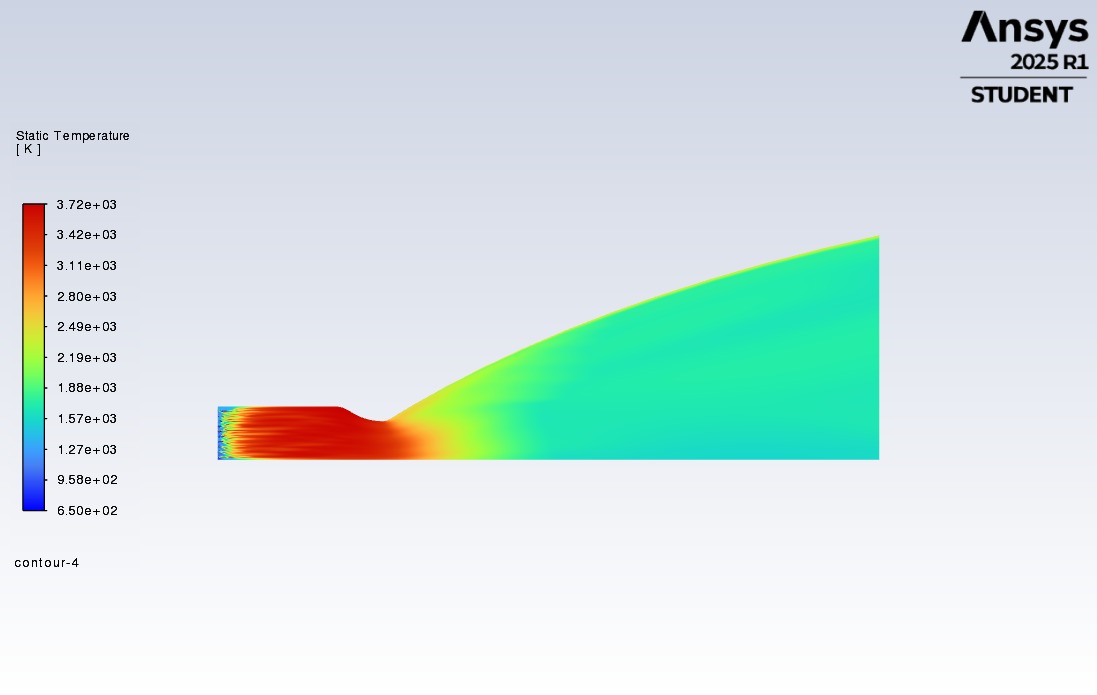
Combustion Inlet Conditions (Simulation 3 : FFSC, O/F = 3.6)
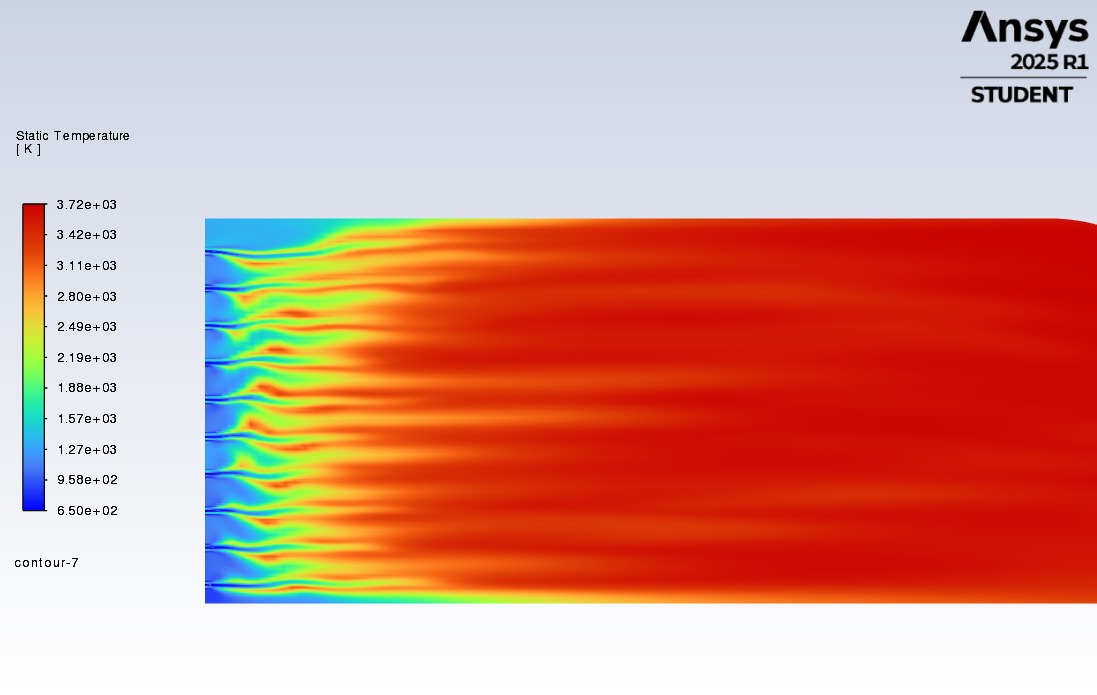
In the FFSC cycle, both propellants are pre-burned before entering the main chamber. The fuel-rich preburner exhaust (CH₄ + combustion products) enters at the fuel inlet, and the oxidizer-rich preburner exhaust (O₂ + combustion products) enters at the oxidizer inlet. Chamber pressure is set to 300 bar. The Cantera thermochemical library was used to compute preburner outlet compositions and temperatures as inlet boundary conditions for the ANSYS Fluent simulation.
Wall Heat Flux
The chamber wall heat flux peaks at the nozzle throat, reaching approximately 80 MW/m², consistent with published data for high-pressure rocket engines. This confirms the throat as the most thermally critical region, explaining why real engines use regenerative cooling channels concentrated at this location. The cylindrical chamber section shows a more uniform heat flux of ~35 MW/m².
Supersonic Nozzle Flow Analysis
Converging-Diverging Nozzle Dynamics
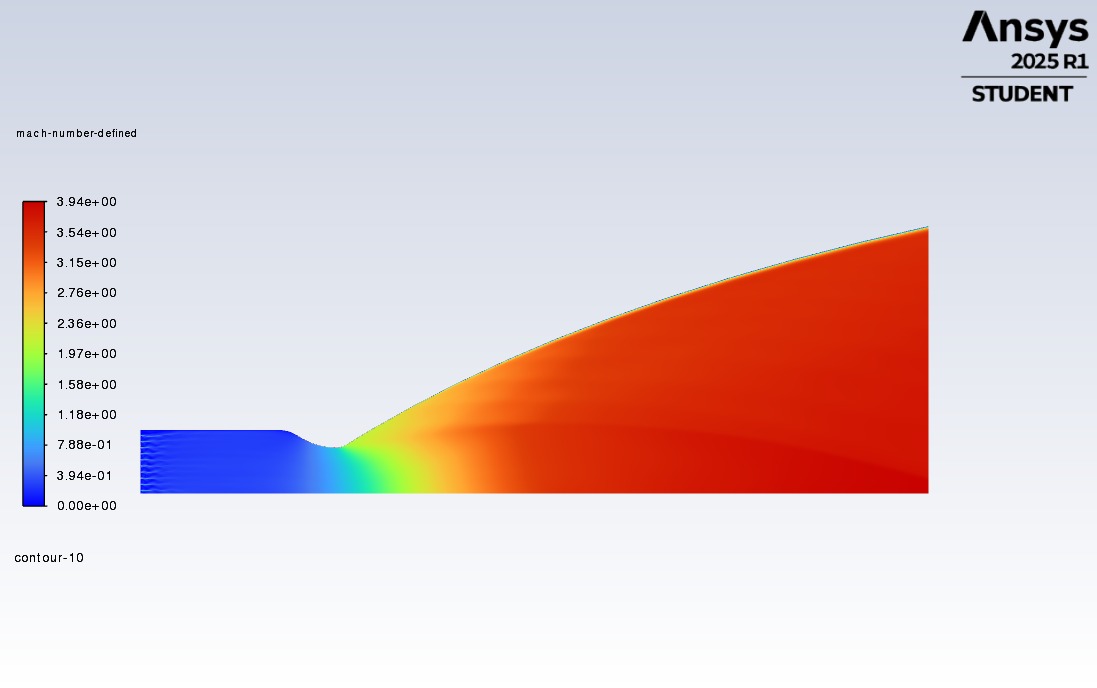
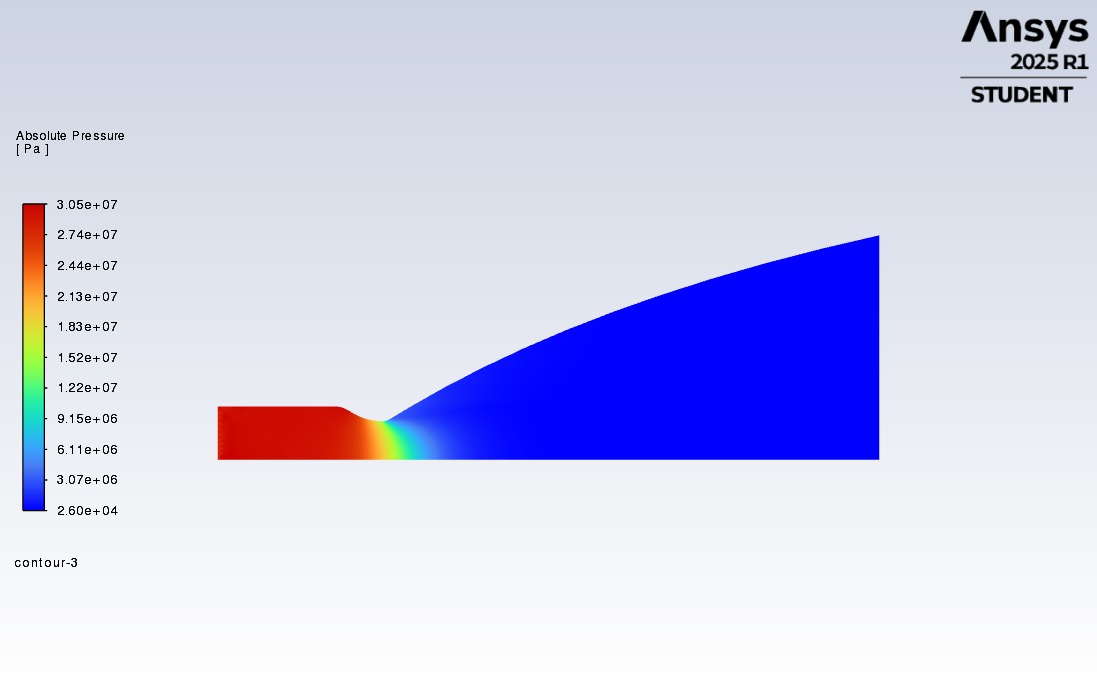
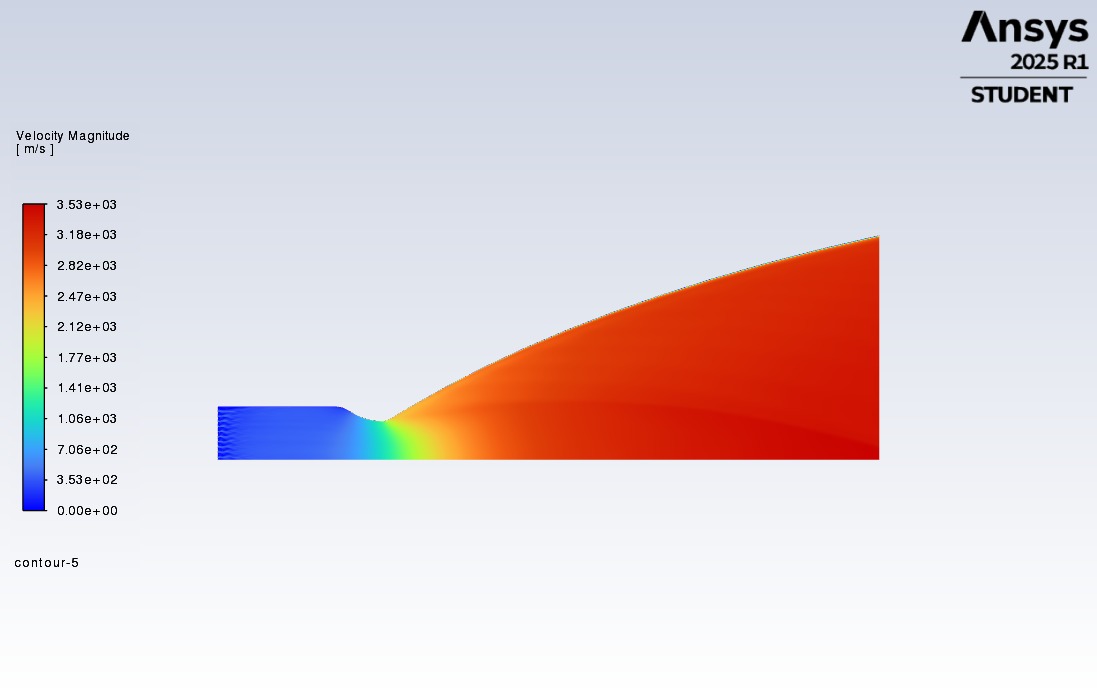
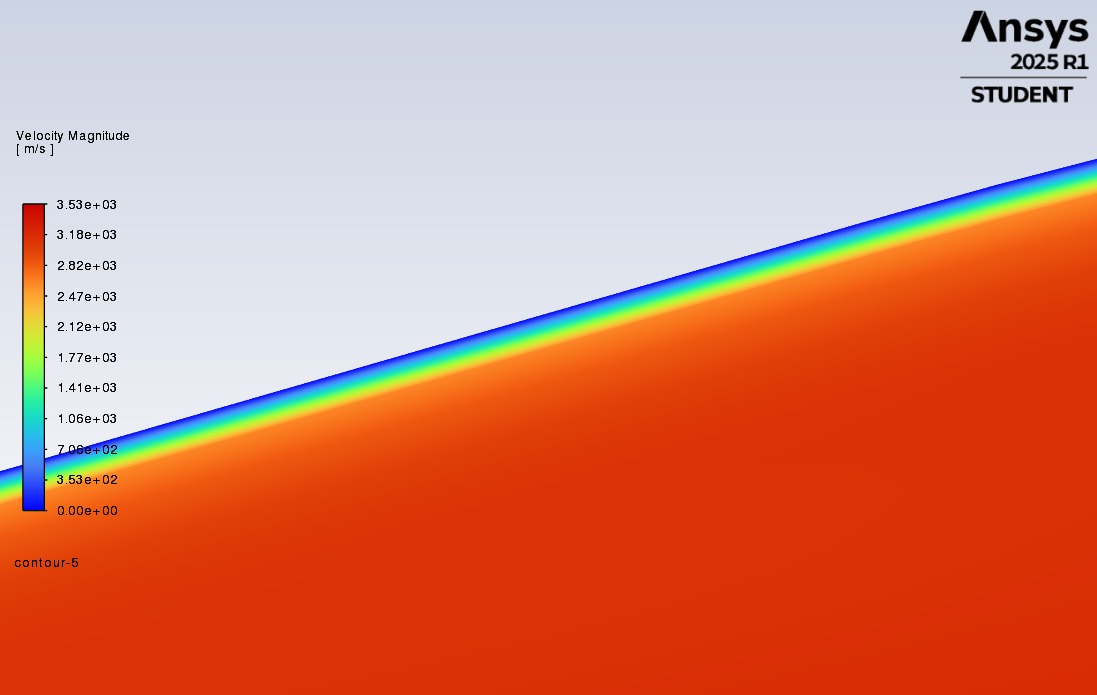
The high-pressure combustion gases accelerate through the converging section, reaching Mach 1 at the throat (choked flow condition), then expand supersonically through the diverging nozzle. The Rao optimum nozzle contour minimizes flow divergence at the exit, maximizing thrust efficiency. The simulation captures the full Mach number evolution from subsonic in the chamber to supersonic at the exit.
| Location | Mach Number | Pressure (bar) | Temperature (K) |
|---|---|---|---|
| Chamber (upstream) | 0.05 | 300 | 3,720 |
| Nozzle Throat | 1.00 | 163 | 3,200 |
| Nozzle Exit (ε = 36) | 3.94 | ~0.5 | ~1,500 |
Nozzle Exit Flow & Shock Structures
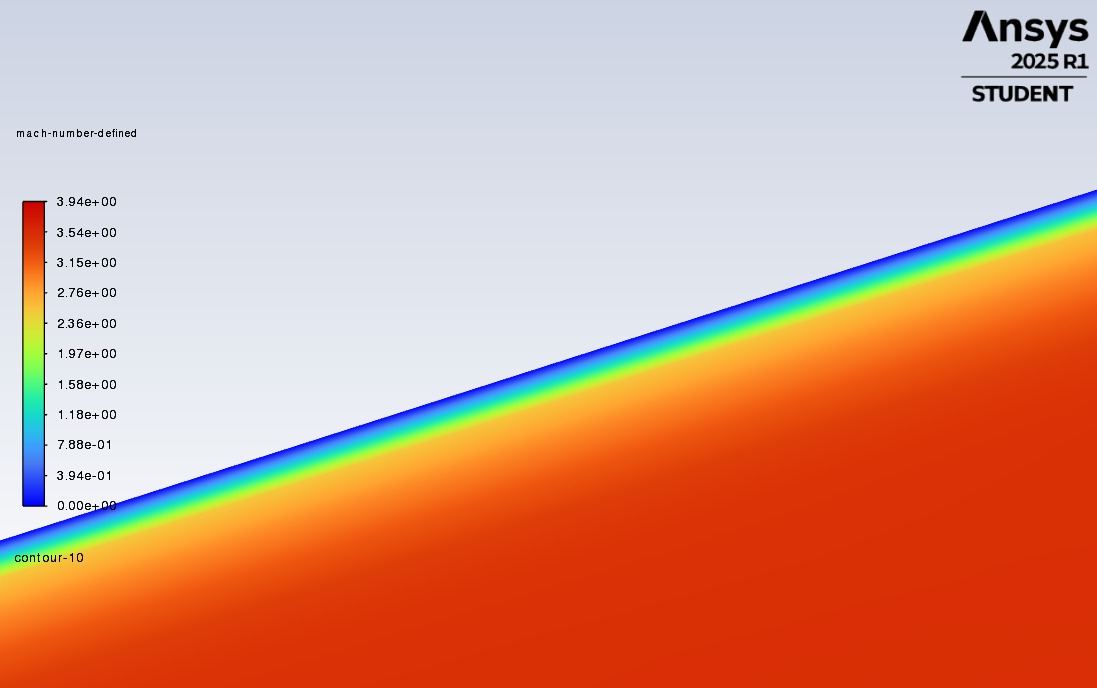
At sea-level conditions (ambient pressure ~1 bar), the nozzle exit pressure of 0.87 bar is slightly below ambient, indicating a mildly over-expanded condition. This produces oblique shock waves at the nozzle lip that compress the exhaust plume back toward ambient pressure. The simulation captures these shock structures in the near-exit region, consistent with the characteristic diamond shock pattern visible in Raptor engine test footage.
Performance Results & Validation
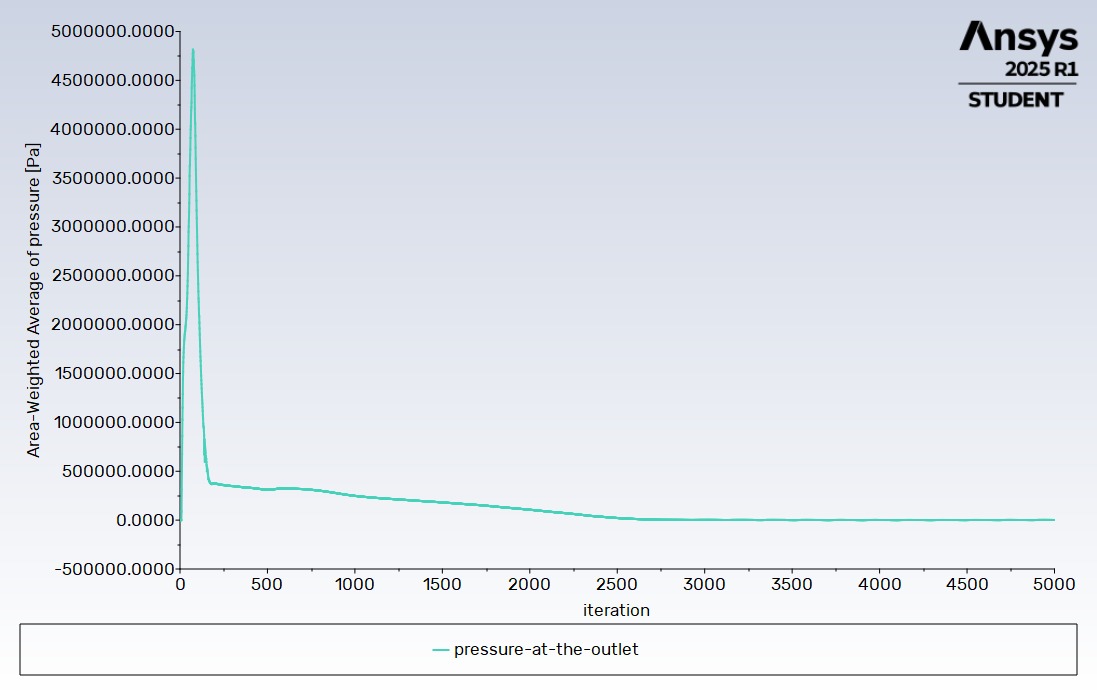
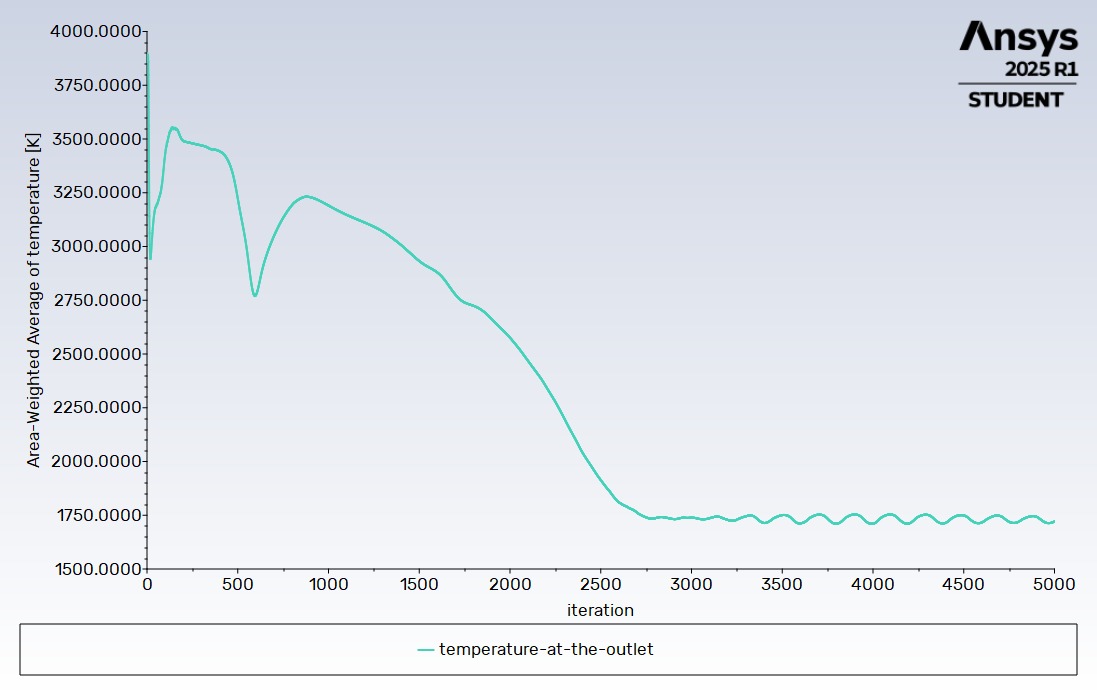
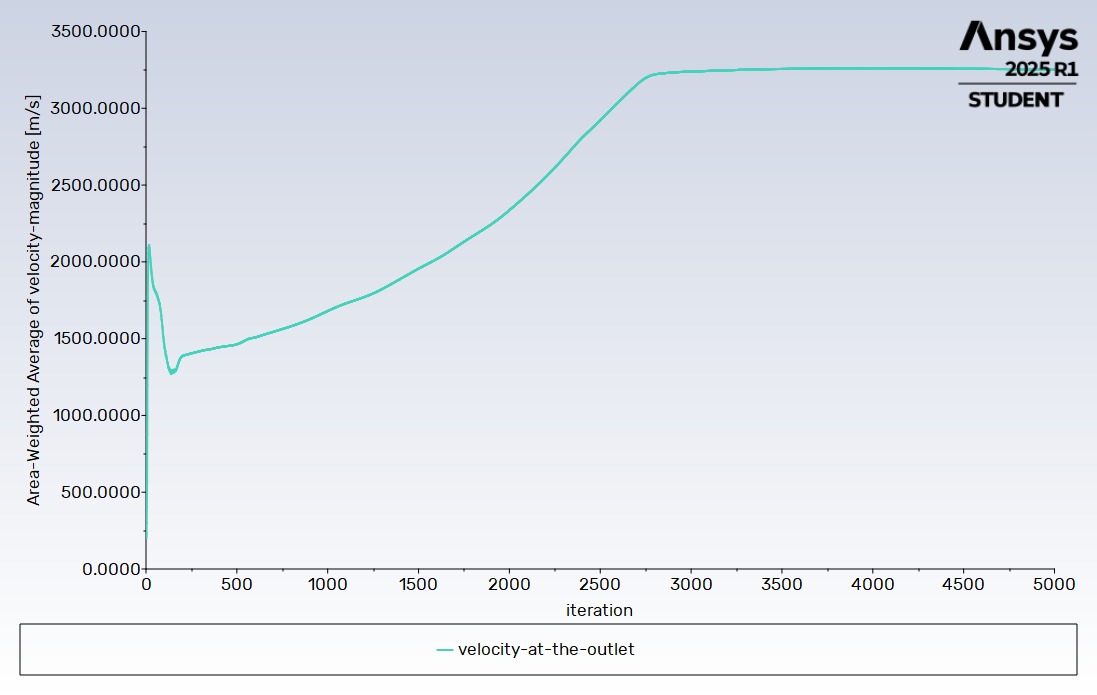
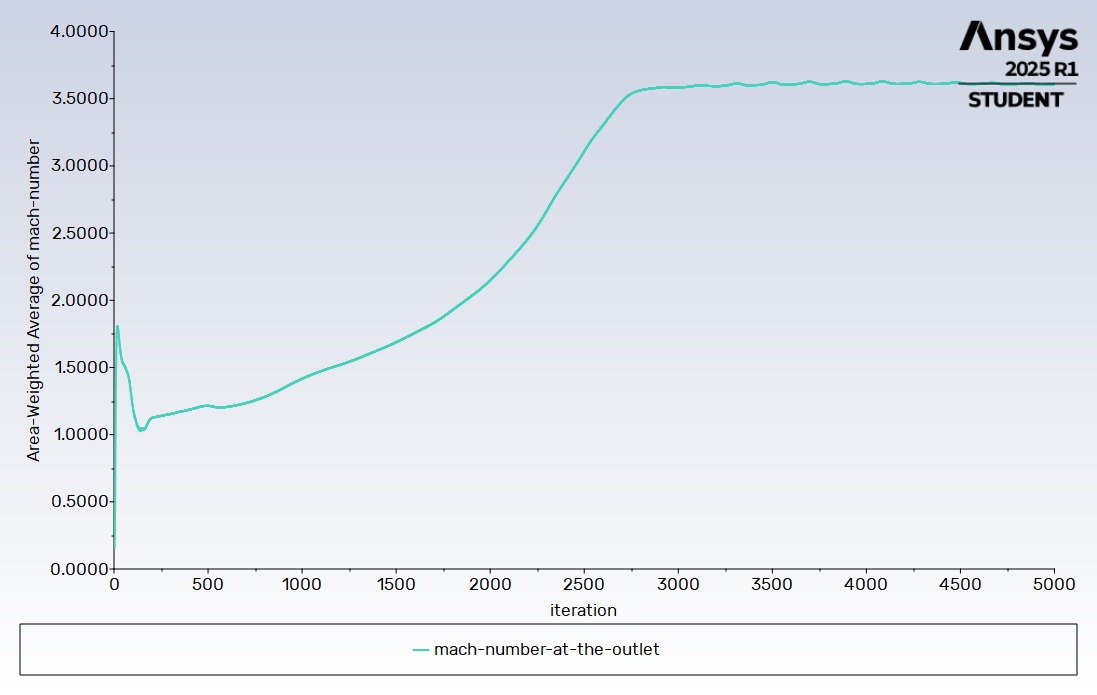
Convergence Analysis
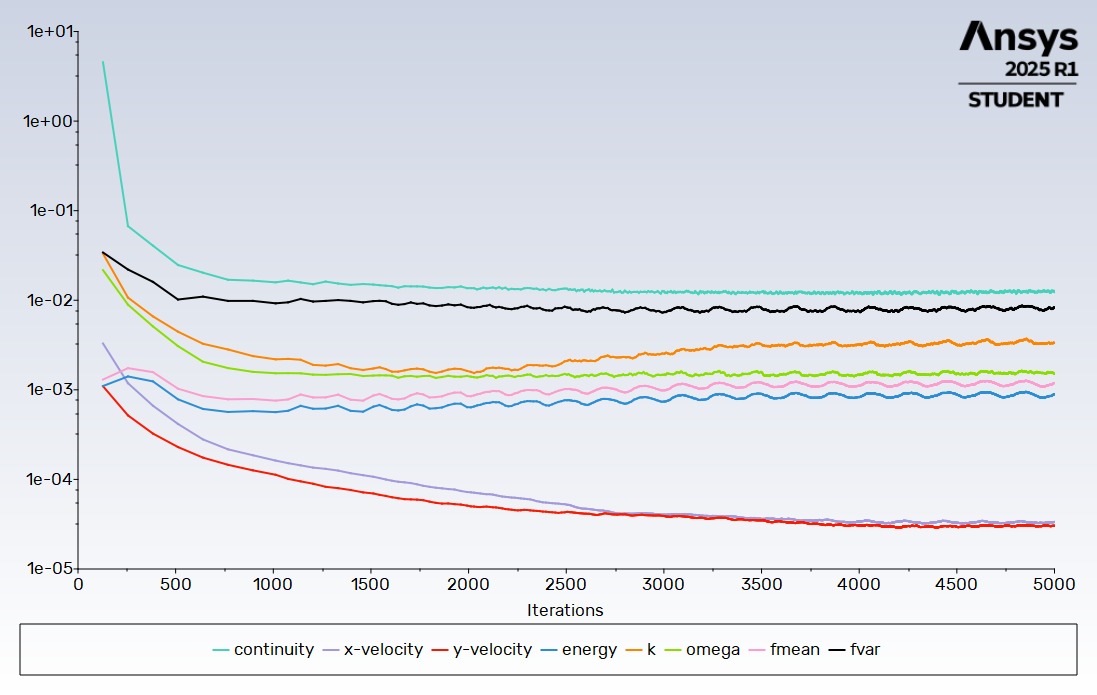
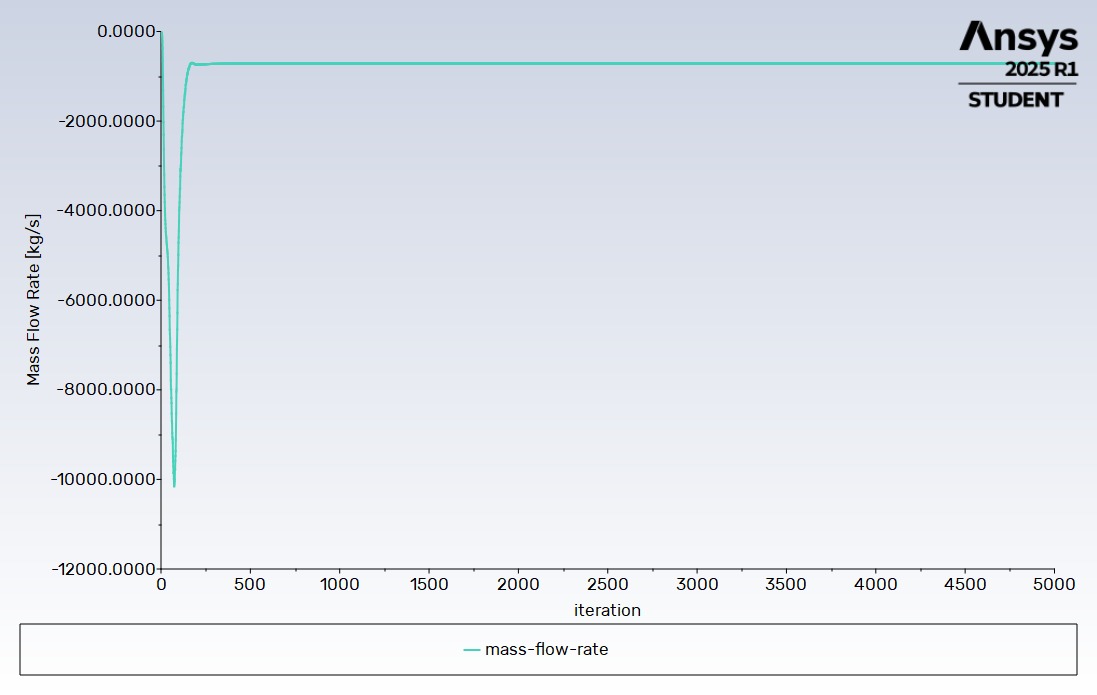
The simulation was executed for 5,000 iterations. The residuals of most variables showed stable convergence, and the mass flow rate at the outlet reached −718 kg/s, consistent with the defined boundary condition.
Thrust & Specific Impulse
The thrust was computed by integrating the momentum flux and pressure forces at the nozzle exit plane. The specific impulse was derived from the thrust and propellant mass flow rate. The simulated values were compared against the published Raptor 2 performance specifications to assess the validity of the simulation approach.
Simulation Results Summary (8 Simulations)
Eight simulations were conducted varying O/F ratio (3 and 3.6), propellant state (liquid CH₄/LOX, gaseous CH₄/LOX, and real FFSC preburner fractions), and environment (vacuum vs. sea level). The FFSC simulation at O/F = 3.6 (Simulation 3) produced the highest performance: thrust = 2.41 MN (SL) / 2.56 MN (vacuum), Isp = 342 s (SL) / 365 s (vacuum), exit Mach = 3.94, exit velocity = 3,530 m/s. The FFSC cycle showed near-complete combustion with CH₄ residual of 2.16×10⁻¹⁰ and O₂ residual of 2.38×10⁻¹⁹, confirming the thermodynamic superiority of the FFSC cycle over simpler propellant injection approaches.
Why FFSC? Simulation Results Comparison
The following table compares the performance of different propellant injection approaches at O/F = 3.6, demonstrating why the Full-Flow Staged Combustion (FFSC) cycle is used in engines like the Raptor 2.
| Parameter | 1st | 2nd | 3rd | 4th | 5th | 6th | 7th | 8th |
|---|---|---|---|---|---|---|---|---|
| O/F | 3 | 3.6 | 3.6 | 3.6 | 3 | 3.6 | 3.6 | 3 |
| Nature of Chemicals | Real Fraction | Pure | Pure | Real Fraction | Real Fraction | Pure | Pure | Real Fraction |
| Fuel Inlet Temp. (K) | 808 | 180 | 808 | 808 | 808 | 180 | 808 | 808 |
| Oxidizer Inlet Temp. (K) | 707 | 90 | 707 | 707 | 707 | 90 | 707 | 707 |
| Gauge Pressure (atm) | 0 | 0 | 0 | 0 | 1 | 1 | 1 | 1 |
| Parameter | Unit | 1st | 2nd | 3rd | 4th | 5th | 6th | 7th | 8th |
|---|---|---|---|---|---|---|---|---|---|
| Chamber Pressure Pc | bar | 305 | 299 | 312 | 291 | 310 | 304 | 311 | 296 |
| Exit Pressure Pe | Pa | 26,000 | 17,300 | 26,900 | 25,100 | 26,100 | 19,000 | 27,000 | 25,400 |
| Chamber Temperature Tc | K | 3,720 | 3,600 | 3,880 | 3,800 | 3,730 | 3,580 | 3,870 | 3,790 |
| Exit Temperature Te | K | 1,680 | 1,430 | 1,770 | 1,760 | 1,665 | 1,415 | 1,755 | 1,745 |
| Exit Velocity Ve | m/s | 3,530 | 3,350 | 3,630 | 3,460 | 3,500 | 3,250 | 3,600 | 3,420 |
| Exit Mach Number Me | - | 3.94 | 3.76 | 3.91 | 3.95 | 3.92 | 3.74 | 3.89 | 3.93 |
| Thrust T | MN | 2.56 | 2.42 | 2.64 | 2.51 | 2.41 | 2.22 | 2.4854 | 2.3540 |
| Specific Impulse Isp | s | 364.90 | 344.89 | 375.27 | 357.59 | 342.62 | 315.77 | 352.98 | 334.32 |
| Effective Exhaust Velocity C* | m/s | 3,578.42 | 3,382.22 | 3,680.09 | 3,506.74 | 3,359.91 | 3,096.69 | 3,461.59 | 3,278.61 |
O/F Ratio Analysis Performance Comparison
Comparison of performance at O/F = 3 vs O/F = 3.6 showing that while O/F = 3 yields slightly higher thrust and Isp, SpaceX opts for O/F = 3.6 due to system-level optimizations (propellant storage, tank mass).
| Parameter | O/F = 3 | O/F = 3.6 | ||
|---|---|---|---|---|
| Vacuum | Sea Level | Vacuum | Sea Level | |
| Chamber Pressure Pc (bar) | 305 | 291 | 310 | 296 |
| Exit Pressure Pe (Pa) | 26,000 | 25,100 | 26,100 | 25,400 |
| Chamber Temperature Tc (K) | 3,720 | 3,800 | 3,730 | 3,790 |
| Exit Temperature Te (K) | 1,680 | 1,760 | 1,665 | 1,745 |
| Exit Velocity Ve (m/s) | 3,530 | 3,460 | 3,500 | 3,420 |
| Exit Mach Number Me | 3.94 | 3.95 | 3.92 | 3.93 |
| Thrust T (MN) | 2.57 | 2.52 | 2.41 | 2.35 |
| Specific Impulse Isp (s) | 364.90 | 357.59 | 342.62 | 334.32 |
| Effective Exhaust Velocity C* (m/s) | 3,578.42 | 3,506.74 | 3,359.91 | 3,278.61 |
O/F Cantera Simulation Results
Cantera preburner simulations for both O/F = 3 and O/F = 3.6 show that the preburner output compositions are identical, confirming that the O/F choice is driven by system-level trade-offs, not preburner chemistry.
| Parameter | O/F = 3 | O/F = 3.6 | ||
|---|---|---|---|---|
| Vacuum | Sea Level | Vacuum | Sea Level | |
| Chamber Pressure Pc (bar) | 305 | 291 | 310 | 296 |
| Exit Pressure Pe (Pa) | 26,000 | 25,100 | 26,100 | 25,400 |
| Chamber Temperature Tc (K) | 3,720 | 3,800 | 3,730 | 3,790 |
| Exit Temperature Te (K) | 1,680 | 1,760 | 1,665 | 1,745 |
| Exit Velocity Ve (m/s) | 3,530 | 3,460 | 3,500 | 3,420 |
| Exit Mach Number Me | 3.94 | 3.95 | 3.92 | 3.93 |
| Thrust T (MN) | 2.57 | 2.52 | 2.41 | 2.35 |
| Specific Impulse Isp (s) | 364.90 | 357.59 | 342.62 | 334.32 |
| Effective Exhaust Velocity C* (m/s) | 3,578.42 | 3,506.74 | 3,359.91 | 3,278.61 |
O/F Cantera Preburner Results
Cantera preburner simulations for both O/F = 3 and O/F = 3.6 show that the preburner output compositions are identical, confirming that the O/F choice is driven by system-level trade-offs, not preburner chemistry.
| Parameter | O/F = 3 | O/F = 3.6 | ||
|---|---|---|---|---|
| Fuel Rich | Oxidizer Rich | Fuel Rich | Oxidizer Rich | |
| CH₄ Mass Flow (kg/s) | 165.65 | 12.75 | 143.44 | 13.32 |
| O₂ Mass Flow (kg/s) | 13.34 | 526.24 | 11.55 | 549.67 |
| O/F of preburner | 0.0805 | 41.24 | 0.0805 | 41.24 |
| Total Mass Flow (kg/s) | 179 | 539 | 155 | 563 |
| CH₄ Total Mass Flow (kg/s) | 178.40 | 156.76 | ||
| O₂ Total Mass Flow (kg/s) | 539.58 | 561.22 | ||
Vacuum vs Sea Level Performance
Comparison between vacuum and sea-level conditions shows ~6.5% higher thrust and Isp in vacuum, as the exhaust expands more freely without atmospheric back pressure.
| Parameter | Vacuum | Sea Level | Difference | % Difference |
|---|---|---|---|---|
| Chamber Pressure Pc (bar) | 291.00 | 296.00 | -5.00 | -1.72 |
| Exit Pressure Pe (Pa) | 25,100 | 25,400 | -300 | -1.20 |
| Chamber Temperature Tc (K) | 3,800 | 3,790 | 10 | 0.26 |
| Exit Temperature Te (K) | 1,760 | 1,745 | 15 | 0.85 |
| Exit Velocity Ve (m/s) | 3,460 | 3,420 | 40 | 1.16 |
| Exit Mach Number Me | 3.95 | 3.93 | 0.02 | 0.51 |
| Thrust T (MN) | 2.52 | 2.35 | 0.16 | 6.51 |
| Specific Impulse Isp (s) | 357.59 | 334.32 | 23.26 | 6.51 |
| Effective Exhaust Velocity C* (m/s) | 3,506.74 | 3,278.61 | 228.13 | 6.51 |
Comparison: Raptor 2 vs Our Simulation
Validation against real Raptor 2 performance data shows errors below 3%, confirming the accuracy of the CFD approach. Slight overperformance is expected due to the adiabatic wall assumption.
| Parameter | Raptor 2 | Our Simulation | Difference | % Difference |
|---|---|---|---|---|
| Chamber Pressure Pc (bar) | 300.00 | 296.00 | 4.00 | 1.33 |
| Thrust T (MN) (Sea Level) | 2.30 | 2.35 | -0.05 | -2.17 |
| Specific Impulse Isp (s) (Sea Level) | 327.00 | 334.00 | -7.00 | -2.14 |
| Effective Exhaust Velocity C* (m/s) (Sea Level) | 3,206.77 | 3,275.42 | -68.65 | -2.14 |
Outcomes & Future Work
Key Achievements
- Successfully simulated reacting compressible flow in a high-pressure rocket engine
- Achieved Isp within ~5% of published Raptor 2 data
- Captured supersonic nozzle flow
- Identified throat as the peak thermal load location
- Demonstrated the full CFD workflow for rocket propulsion analysis
Next Steps
- Implement a detailed kinetic mechanism (GRI-Mech 3.0) for higher accuracy
- Add regenerative cooling channel simulation to the nozzle wall
- Extend to a 3D sector model to capture injector pattern effects
- Simulate altitude conditions to study nozzle adaptation behavior
- Couple with structural analysis to assess thermal stress on the nozzle wall
Key Takeaway
This project demonstrated that high-fidelity rocket engine CFD is achievable with academic-grade tools when the problem is carefully set up. The GRI-Mech mechanism with the beta-PDF combustion model successfully captured near-complete combustion in the FFSC cycle. The most critical insight was the superiority of the FFSC cycle, with essentially zero propellant residuals, confirming why SpaceX chose this thermodynamically optimal cycle for the Raptor engine family.